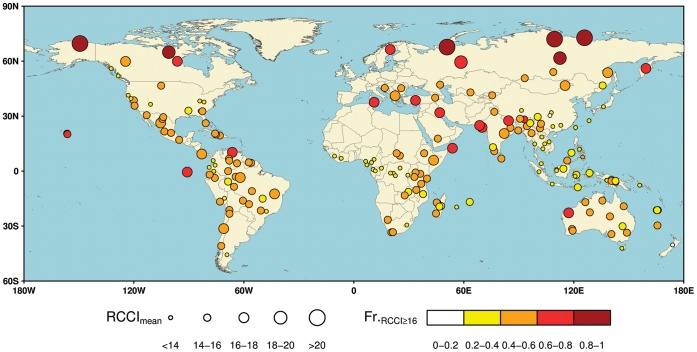
Figure 2. The spatial distributions of Regional Climate Change Index (RCCI) across 196 G200 ecoregions.
Based on differences in climate conditions between 1991−2010 and 2081−2100 generated from the ensemble of 62 GCM × GHG emission scenario combinations, the relative climate-change exposure of each G200 ecoregion is indicated by the multi-model mean RCCI (RCCImean, illustrated as the size of the symbol) and the proportion of GCM × GHG emission scenario combinations with RCCI ≥16 (Fr.RCCI≥16, illustrated as the color of the symbol).

