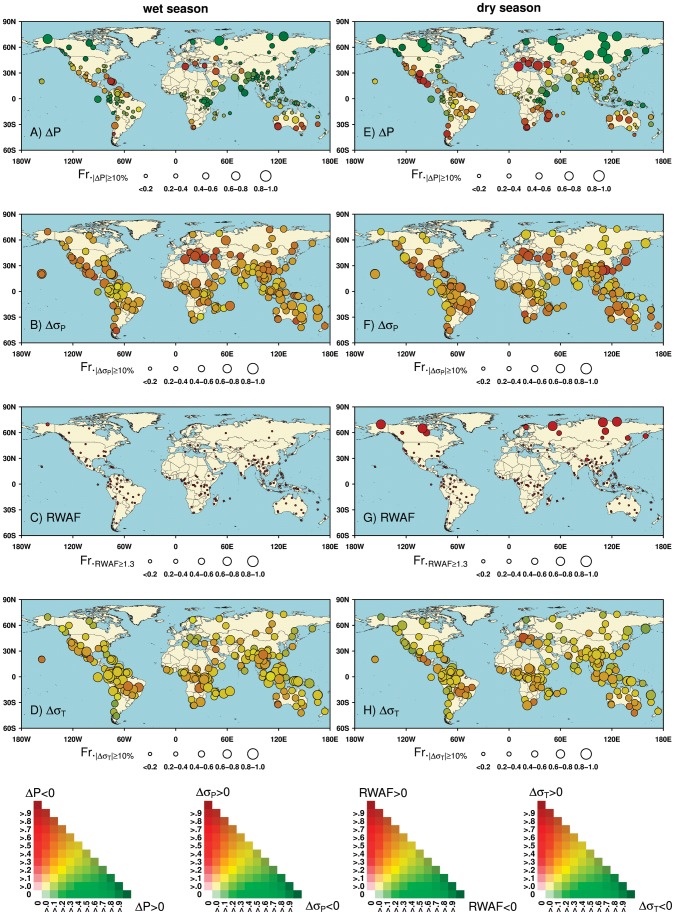
Figure 3. Changes in component climatic factors of Regional Climate Change Index (RCCI) across 196 G200 ecoregions.
A) Wet season ΔP; B) wet season ΔσP; C) wet season RWAF; D) wet season ΔσT; E) dry season ΔP; F) dry season ΔσP; G) dry season RWAF; H) dry season ΔσT. The calculation is based on differences in climate conditions between 1991–2010 and 2081–2100, generated from the ensemble of 62 GCM × GHG emission scenario combinations. The changing magnitude of each component climatic factor is indicated by the proportion of GCM × GHG emission scenario combinations with the absolute value of the corresponding integer “n” ≥2 (illustrated as the size of the symbol). The changing direction is indicated by the proportion of combinations where an increase or decrease is projected to occur (illustrated as the color of the symbol).

