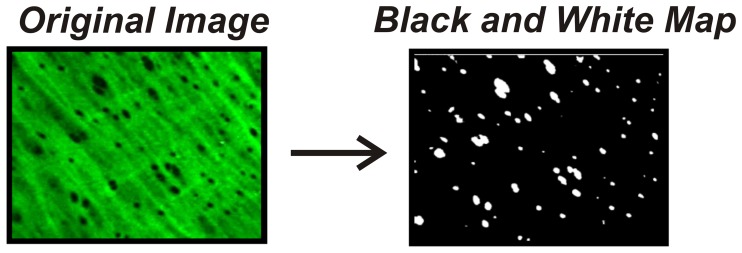
Figure 1. Depiction of internal elastic lamina fenestration and conversion for fenestrae quantification.
Autofluorescence of the internal elastic lamina was imaged via laser scanning confocal microscopy. Following 3-dimensional volume rendering, images were recorded and reconstructed using Volocity 6.0.0 to produce a black and white map which allowed for detection of fenestrae via Image J software analysis.

