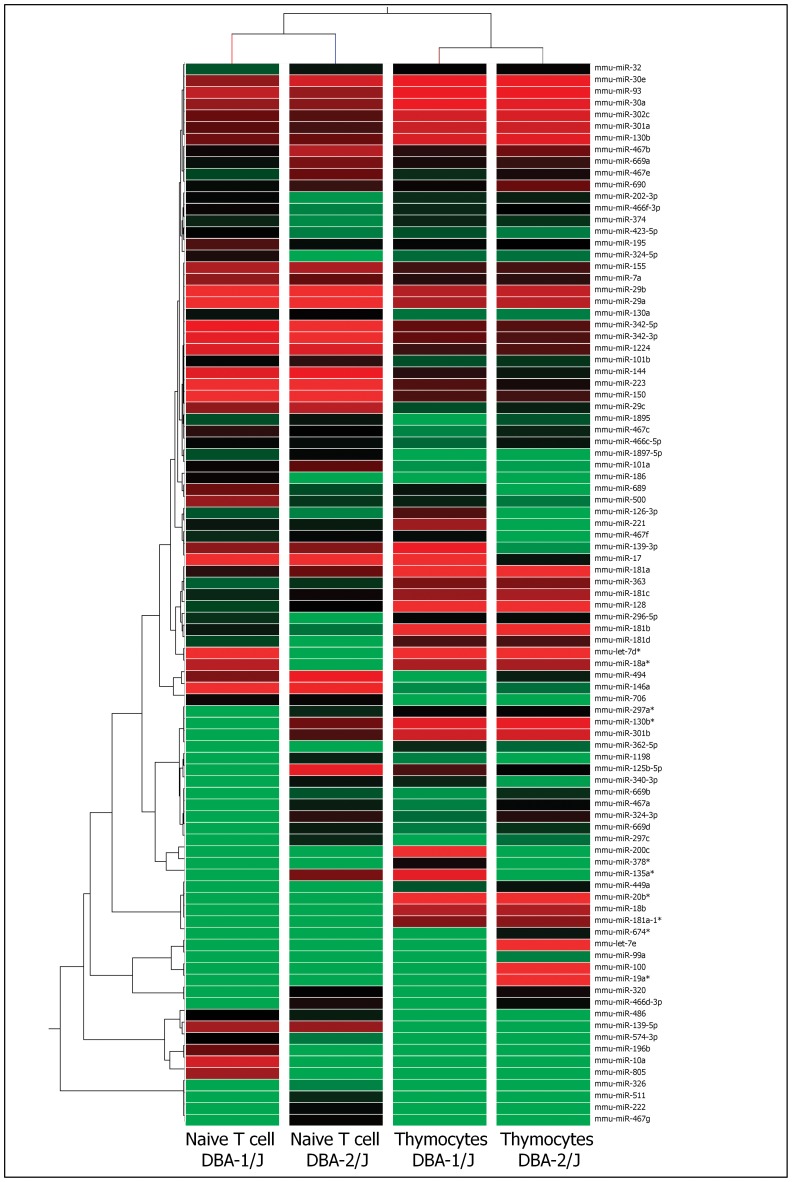
Figure 1. Modulation of miRNAs as evaluated by microarrays.
Hierarchical clustering and color heat-map of miRNome (miRNAs) of thymocytes isolated from 4-week-old DBA-1/J and DBA-2/J mice and CD3+ T cells from the spleen and lymph nodes of 4-week-old mice from both strains based on microarray expression profiling. The dendrogram and heat-map were obtained using cluster and tree-view algorithms through Agilent GeneSpring platform. Heat map legend: Red = up regulation, green = down regulation, black = unmodulated (Pearson correlation metrics).

