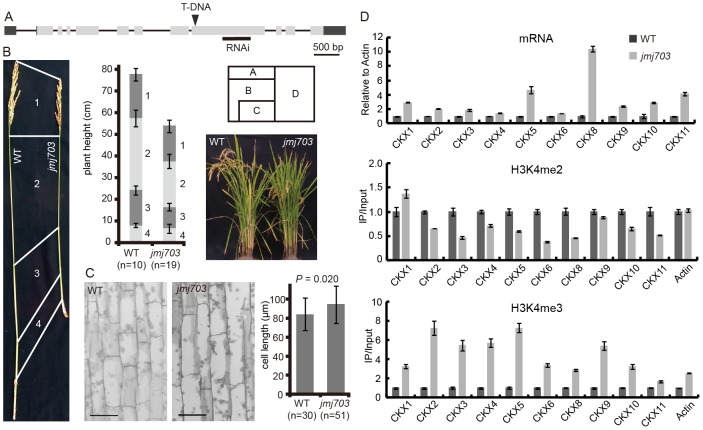
Figure 1. Phenotype of jmj703 mutants.
(A) T-DNA insertion and RNAi locations within the JMJ703 gene. (B) Comparison of the main panicle internodes between wild type and mutant plants. Lengths of the uppermost internodes were measured. (C) Comparison of stem epidermal cell lengths between wild type and mutant plants. No significant difference of cell lengths between wild type and mutant plants is detected by t-tests (p = 0.02). Bar = 50 µm. (D) Relative expression, H3K4me2 and H3K4me3 levels of cytokinin oxidase (CKX) genes in wild type and mutant plants. Expression levels in wild type are set as 1.

