
Figure 5. The active site of c-JMJ703.
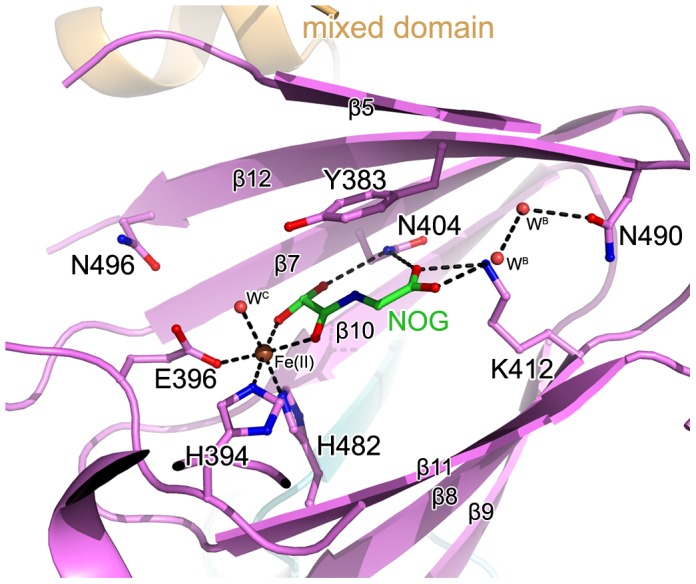
The interaction network of NOG (colored green), Fe(II) (colored brown), and c-JMJ703 residues (colored purple) involved in the interactions are shown. The H3K4me3 peptide is colored yellow. The secondary structure surrounding the active site is shown as a purple cartoon.