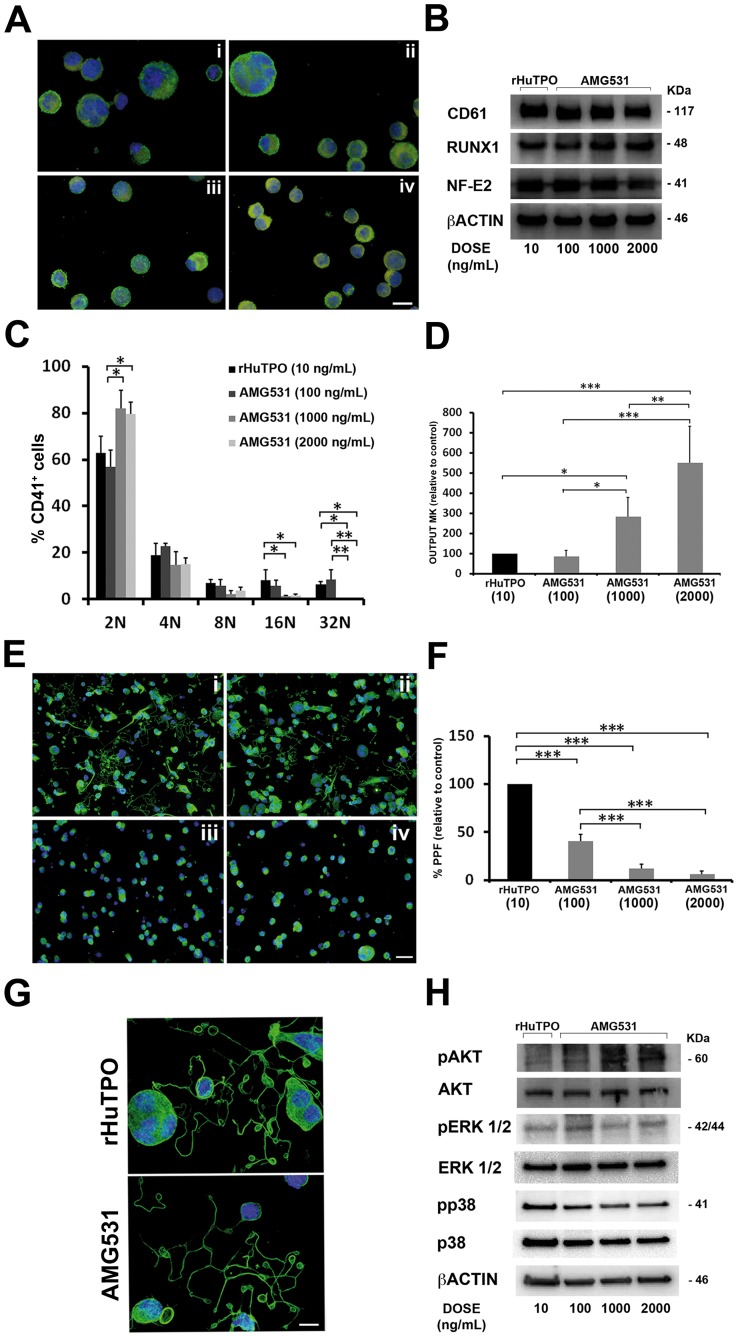
Figure 2. Effect of AMG531 on MK development.
MKs were differentiated from human umbilical cord blood progenitors and cultured for 13 days in presence of AMG531 at different concentrations. 10 ng/mL of rHuTPO was used as control. (A) Immunofluorescence images of MKs cultured with rHuTPO 10 ng/mL (i) or AMG531 100 ng/mL (ii), 1000 ng/mL (iii) and 2000 ng/mL (iv) at day 13 of culture. Cell samples were citospun on 12 mm cover slips and stained with anti-CD61 antibody (green). Nuclei were counterstained with Hoechst 33288 (blue). Images were acquired through an Olympus BX51, magnification 63×. Scale bar = 25 µm. (B) Western blot analysis of MK differentiation markers CD61, RUNX-1, NFE2. Samples were probed with anti β-actin antibody to demonstrate equal loading. (C) Ploidy levels of MKs was analyzed by flow cytometry as described in Design an Methods. Data are expressed as mean ± SD of 3 different experiments. *p<0.05, ** p<0.01. (D) MK output was calculated as the percentage of CD61+ cells at day 13 of culture and normalized to the total number of CD34+ cells at the beginning of the cell culture (values in parenthesis represent rHuTPO or AMG531 concentrations, expressed as ng/mL). The error bars represent the mean ± SD of 6 independent experiments. *p<0.05, ** p<0.01, ***p<0.001. (E) Immunofluorescence images of proplatelet formig-MKs derived from cultures treated with rHuTPO 10 ng/mL (i) or AMG531 100 ng/mL (ii), 1000 ng/mL (iii) and 2000 ng/mL (iv) stained with anti α-tubulin antibody (green). Nuclei were stained with Hoechst 33288 (blue). Images were acquired through an Olympus BX51, magnification 20×. Scale bar = 50 µm. (F) Histogram shows proplatelet formation (PPF) analyzed after 16 hour adhesion on fibrinogen (values in parenthesis represent rHuTPO or AMG531 concentrations, expressed as ng/mL). The error bars represent the mean ± SD of 5 independent experiments. ***p<0.001. (G) Representative images of proplatelet revealed with anti α-tubulin staining (green). Nuclei were counterstained with Hoechst 33288 (blue). Images were acquired through an Olympus BX51, magnification 63×. Scale bar = 20 µm. (H) Western blot analysis of pAKT, pERK1/2 and pp38 in MKs at day 13 of culture. AKT, ERK1/2, p38 and β-actin were revealed to show equal loading.

