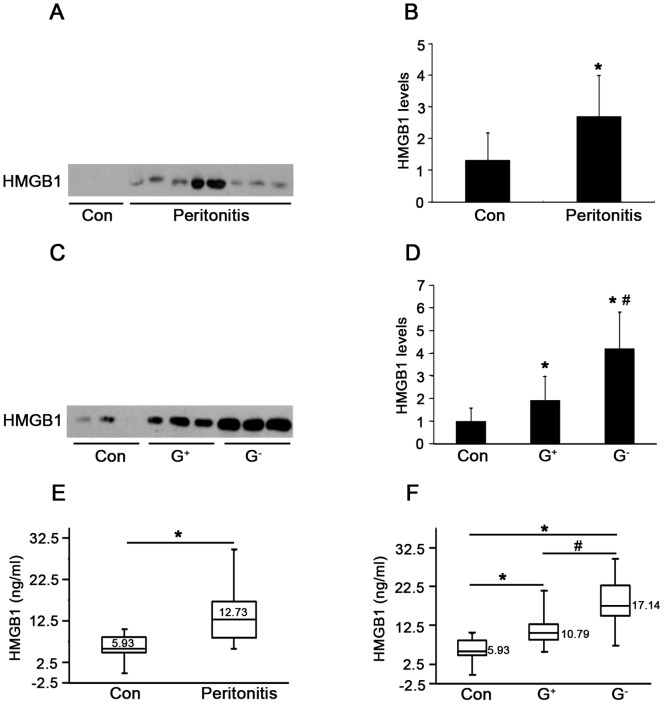
Figure 1. HMGB1 levels in peritoneal dialysis effluents (PDE).
(A) Levels of HMGB1 in PDE of patients with or without peritonitis were detected by western blotting. PD patients without peritonitis served as controls (Con). (B) Densitometry of HMGB1 in immunoblots. Data are means ± SE (n = 3), *P<0.05 versus control subjects. (C) Representative immunoblot for HMGB1 in PDE among patient subgroups, including patients without peritonitis, with Gram-positive (G+) and Gram-negative (G−) peritonitis. (D) Quantitative determination of the relative abundance of HMGB1 protein among different groups. Data are means ± SE (n = 3), *P<0.05 versus control subjects. (E) Levels of HMGB1 in PDE of patients with or without peritonitis were quantified by ELISA. (F) Levels of HMGB1 in PDE among patient subgroups were assayed by ELISA. The box plot in E and F represents (from the top) values of the maximum, the third quartile, the median, the first quartile and the minimum, respectively (n = 4). *P<0.05 versus no peritonitis, # P<0.05 versus Gram-positive peritonitis.

