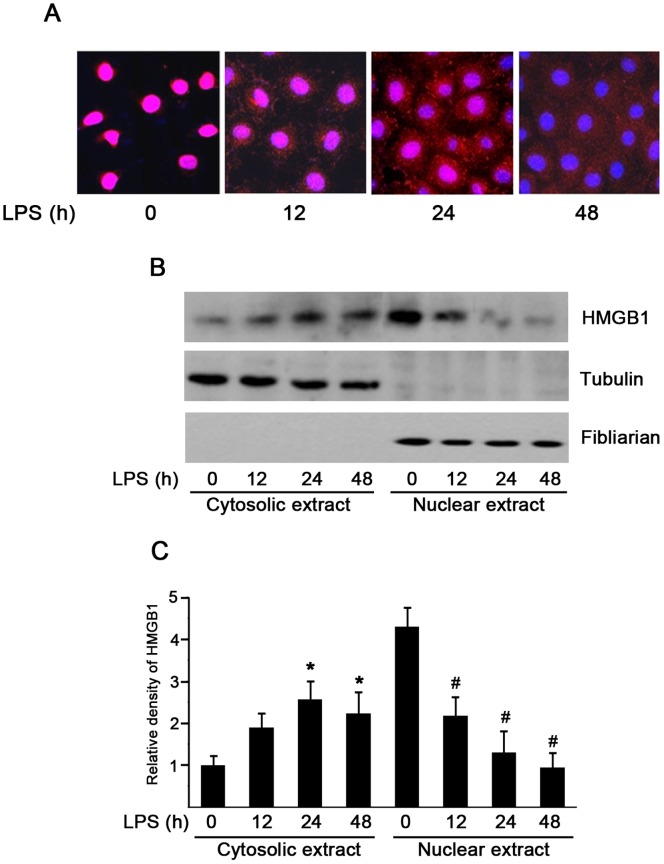
Figure 7. HMGB1 nuclear-cytoplasmic translocation in LPS-induced HMrSV5 cells.
Cells were treated with 2 µg/ml LPS for the indicated time period. (A) Representative confocal microscopic images showed the cellular localization of HMGB1 (red) and nuclear staining (blue) by indirect immunofluorescence staining in cells. Original magnification×400. (B) HMGB1 content in cytoplasm and nuclear fractions after LPS stimulation were assessed by Western blot analysis. (C) Quantitative determination of the relative abundance of HMGB1 in the cytoplasm and the nucleus among different groups. Data are expressed as mean±SE of three experiments. *P<0.01 versus negative control in the cytoplasm; #P<0.01 versus negative control in the nucleus.

