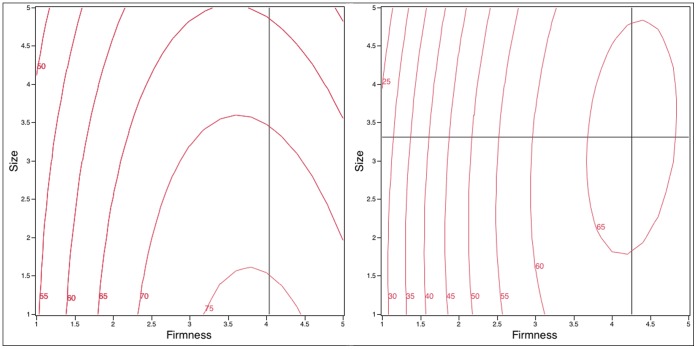
Figure 3. Contour plots of insertion ratings (0–100) as a function of design variables (Firmness and Size) in the with-Applicator (left) and without-Applicator groups (right).
The cross hairs indicate the location of the maximum value; the optimal size for the with-applicator group was below 1 (outside the design space) and is not shown. A shaded region is not shown given the large differences in maximal values.

