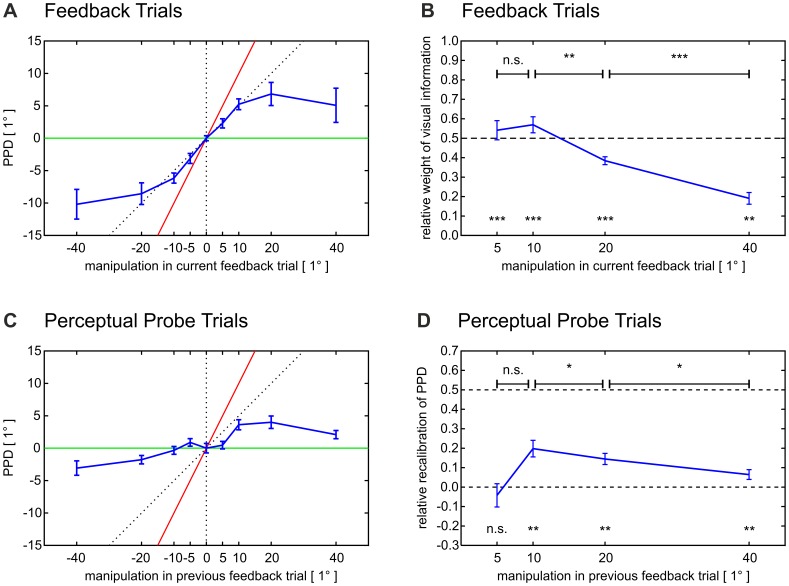
Figure 3. Error attribution and recalibration of internal sensory predictions.
(A) Perceived pointing direction in feedback trials. Subjects’ perceived pointing direction (PPD, blue curve), which is here plotted versus the manipulation applied to the visual feedback, allowed us to estimate the component of the feedback manipulation – and thus of the visual prediction error – which subjects attributed to internal causes. The PPD strongly reflected the size of the feedback manipulation (red line) if these manipulations were small. If manipulations were large, vice versa, subjects’ estimated pointing direction rather resembled the motor pointing direction (green line). By varying the size of the feedback manipulations, we thus gradually manipulated the error component which subjects attributed to internal causes. (B) Relative weight of visual information. We captured the internally attributed share of the prediction error by the relative weight which visual feedback obtained in subjects’ PPD. The relative weight of visual information was defined as the quotient of subjects’ offset-corrected PPD (compare A) and the manipulation applied to the visual feedback. Relative visual weights of 1 and 0 would indicate that a subject attributed the prediction error either entirely internally or, respectively, entirely externally. The relative visual weight was significant for all amounts of manipulation (one-sample one-tailed t-tests), but also quantitatively modulated by the absolute amount of manipulation: increasing error sizes resulted in decreasing shares of the internally attributed error component (paired one-tailed t-tests). (C) Perceived pointing direction in perceptual probe trials. The recalibration of subjects’ internal sensory predictions was reflected by the PPD in perceptual probe trials (blue curve), which is here plotted versus the feedback manipulation applied in the immediately preceding feedback trial. Recalibration was not proportional to the preceding prediction error, i.e. the preceding feedback manipulation, but instead resembled the error component which subjects had attributed internally, i.e. their PPD in the preceding feedback trial (compare A). By way of illustration, the green line shows the assumption that prediction errors would not induce any recalibration. Likewise, the red line corresponds to the assumption that subjects adjusted the perceived pointing direction to the entire amount of the preceding feedback manipulation. (D) Relative recalibration of internal sensory predictions. We defined the relative recalibration to compare the recalibration induced by prediction errors of variable size. The relative recalibration was the quotient of the offset-corrected PPD in a given perceptual probe trial (compare C) and the manipulation applied in the preceding feedback trial. The relative recalibration was significant for amounts of manipulation as large as 10°, 20° and 40° (one-sample one-tailed t-tests), which means that manipulations induced recalibration if exceeding a minimum threshold. Moreover, the amount of manipulation modulated the relative recalibration quantitatively: increasing amounts of manipulation resulted in decreasing values of relative recalibration (paired one-tailed t-tests). Diagrams show mean values ± standard errors calculated across subjects. All reported P-values are Bonferroni-corrected for multiple comparisons within each measure (*** P<.001, ** P<.01, n.s. P≥.10). Positive angles denote counterclockwise rotations.

