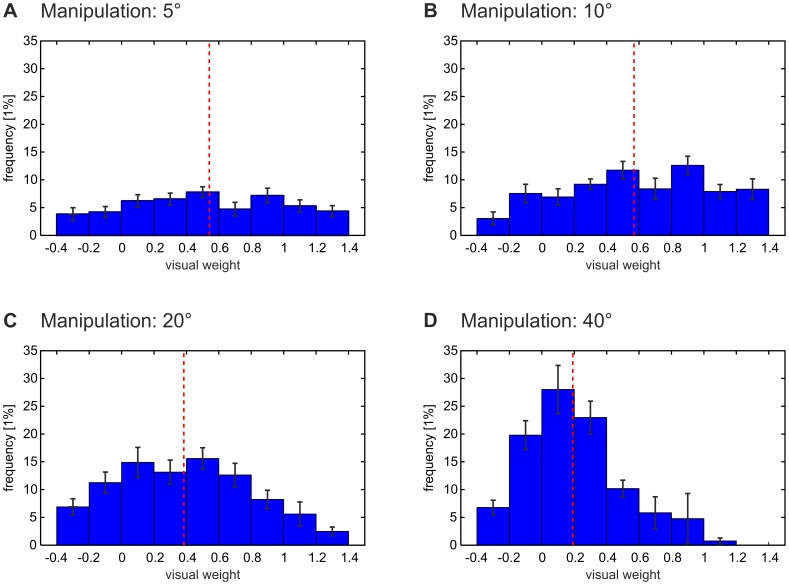
Figure 4. Distribution of the relative weight of visual information.
These histograms (mean ± standard error) display the density distribution of the relative weight of visual information across feedback trials. The relative weight of visual information was defined as the quotient of subjects’ offset-corrected perceived pointing direction and the feedback manipulation applied in the same trial (compare Figure 3B). For all amounts of feedback manipulation (5° in A, 10° in B, 20° in C, 40° in D), the histogram exhibits one single peak, indicating a unimodal density distribution. This peak corresponds to the mean relative weight of visual information (broken red line). This finding shows that subjects integrated the internally predicted and the actual sensory consequences of their actions on the level of individual trials when estimating their pointing direction. Alternatively, subjects could have based their estimates solely on internal signals in one trial (corresponding to a relative visual weight of 0) while relying entirely on visual information in another (corresponding to a relative visual weight of 1). This would have resulted in bimodal density distributions, which are not supported by our data. To further support this notion, we statistically examined the distribution of the relative visual weight in feedback trials separately for each subject (n = 11) and for each amount of feedback manipulation (5°, 10°, 20°, 40°). We applied the Shapiro-Wilk test to each of these 44 distributions, testing the null hypothesis that the sample came from a normally distributed population. We found that the null hypothesis was tenable in 41 of the 44 samples (P≥.05, uncorrected). This indicates that, indeed, the relative visual weight was normally and therefore unimodally distributed, both across subjects and feedback manipulations.

