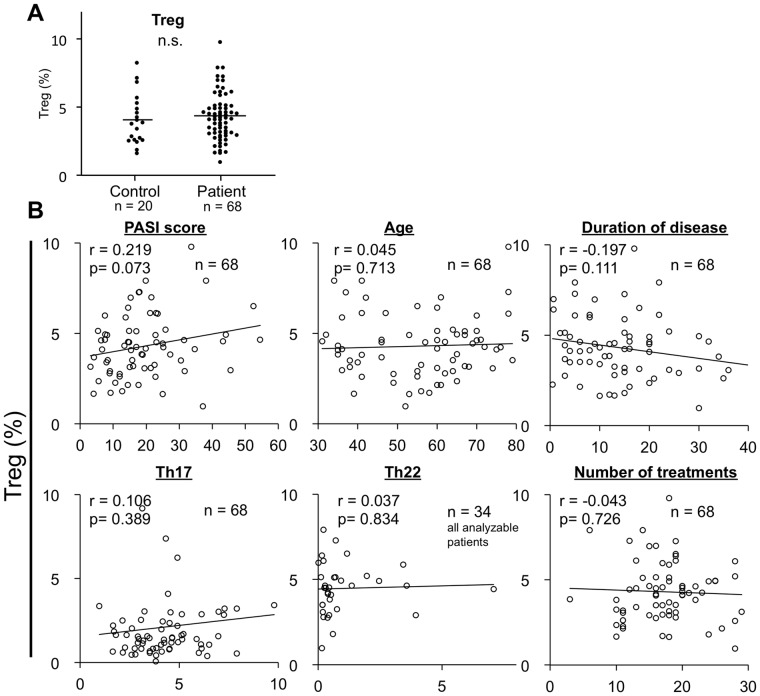
Figure 1. Circulating Treg levels in patients with psoriasis.
(A) Dot plots show percentages of Treg in patients and controls. Horizontal bar indicates mean value. (B) The correlations between Treg levels and the other parameters, such as PASI score, age, disease duration, number of treatments and Th17, Th22 levels were examined.

