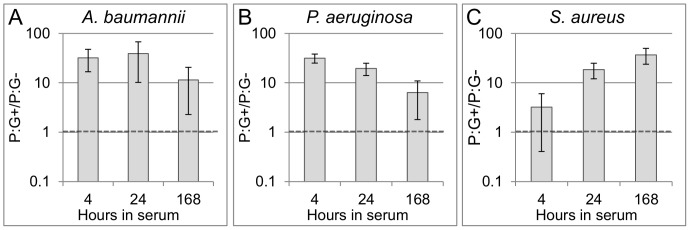
Figure 3. Ratiometric pre-rRNA analysis of A. baumannii (A), P. aeruginosa (B), and S. aureus (C) cells in serum over time.

Three biological replicates for each organism were prepared at ∼1E5 CFU/mL in serum and analyzed after 4, 24, and 168 hours of serum acclimation. At each timepoint, nutritional stimulation was initiated by suspending cells in pre-warmed TSB for 1.5 hours. Changes in pre-rRNA are expressed as means and standard deviations of the fold-increases in P:G ratio following nutritional stimulation, relative to non-stimulated control aliquots (P:G+/P:G−). The horizontal dashed line indicates the “viability threshold” which samples with viable cells are expected to exceed. From separate gDNA standard curves consisting of ≥ five points each, qPCR efficiencies were between 1.010 and1.067.
