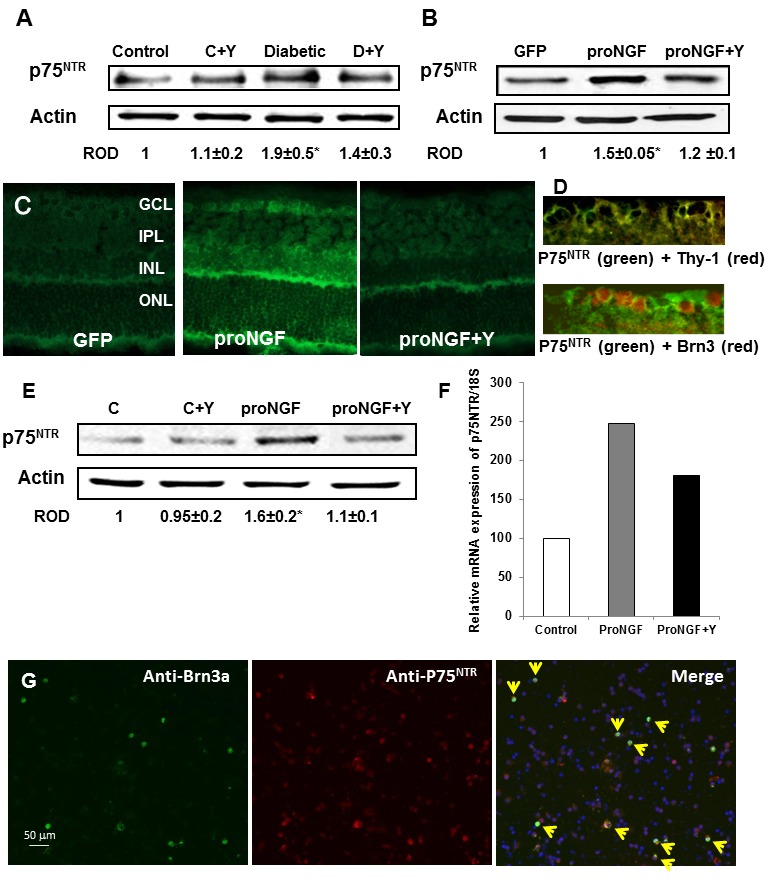
Figure 4. Diabetes and overexpression of proNGF induced expression of p75NTR in vivo and in vitro.

A. WB analysis showing 1.9-fold increase in the expression of p75NTR in diabetic rats as compared with the controls (n = 4–6). B. WB analysis of rat retinal lysate showed significant increase in p75NTR expression in rats electroporated with proNGF as compared with those electroporated with GFP (n = 4). C. Representative images of rat retina sections showing prominent immunolocalization of p75NTR in GCL and INL in proNGF overexpressing retinas as compared with GFP-controls (400× magnification). D. Representative images of rat retina sections showing colocalization between p75NTR in the ganglion cell layer (green) and the specific neuronal marker Thy-1 (red) in the upper pannel or with the specific RGC marker Brn-3a (red)in the lower pannel (400× magnification). E. Western blot analysis shwoing 1.6-fold increase in the expression of p75NTR in RGC-5 cells treated with proNGF as compared with the controls (n = 4). F. Real-time PCR analysis showing that proNGF induced p75NTR mRNA expression in freshly isolated primary RGC as compared with the control group. Samples of primary RGC cultures were pooled from 4-different cultures. Treatment with Y27632 significantly reduced p75NTR expression in vivo and in vitro. G. Representative images showing colocalization (yellow arrow heads) of RGC that expressed p75NTR (red) and the specific RGC marker Brn3a (green) in isolated mixed neuronal cultures from adult mice. * = significant difference as compared with the rest of the groups at p<0.05. C, control; GCL, ganglion cell layer; IPL, inner plexiform layer; INL, inner nuclear layer; ONL, outer nuclear layer. C, control.
