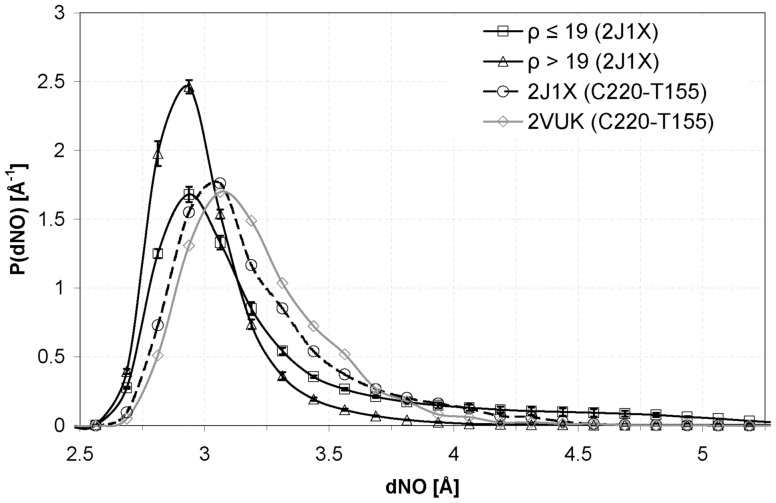
Figure 6. Distribution for the distance between the amidic N atom and the carbonylic O atom.
HBs with ρ>19 (well wrapped) in 2J1X (μ = 2.949 and σ = 0.276), HBs with ρ≤19 (poorly wrapped) in 2J1X (μ = 3.208 and σ = 0.564), CYS 220– THR 155 in 2VUK (μ = 3.150 and σ = 0.288) and CYS 220– THR 155 in 2J1X (μ = 3.143 and σ = 0.339). Attention should be paid to the tails of the distributions, that is, at large values of the N-O distance. These data come from the study of the three replicas for each case.

