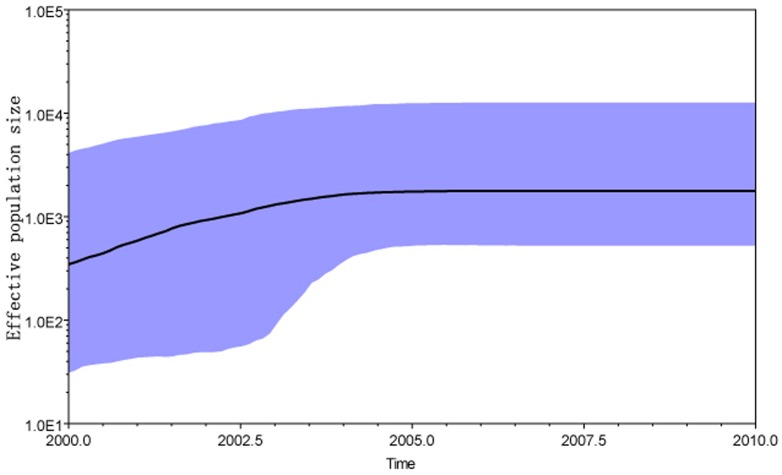
Figure 2. Baysian skyline plot was estimated to reconstruct the demographic history of CRF01_AE cluster 4 in Northeast China.
The x axis is the time in units of years, and the y axis is equal to the effective population size. The thick solid line is the mean estimates, the 95% HPD credible region is showed by blue areas.

