
Figure 2. Change of the percentage of motility in various VP treatment concentrations.
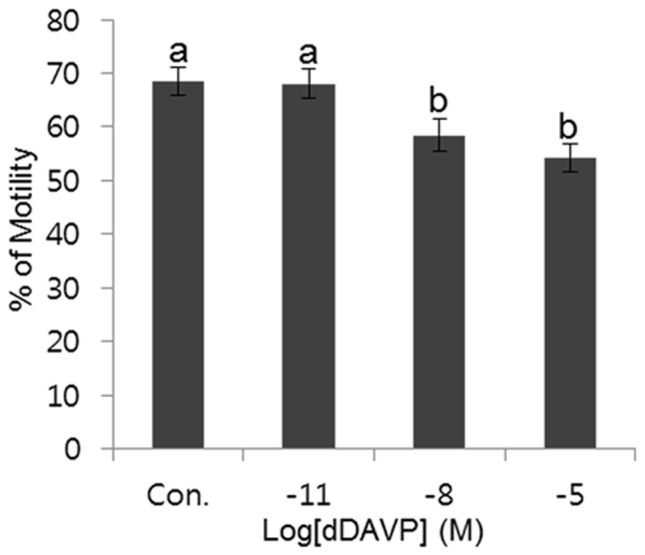
Data represent mean ± SEM, n = 6. Values with different superscripts (a,b) were significantly different between control and treatment groups by one-way ANOVA (p<0.05).