
Figure 6. Effect of dDVAP on fertilization and embryo development.
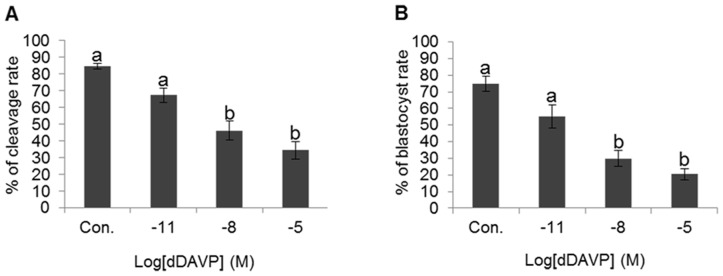
(A) Change of cleavage rate in various treatment conditions. (B) Change of blastocyst rate in various treatment conditions. Data represent mean ± SEM, n = 6. Values with different superscripts (a,b) were significantly different between control and treatment groups by One-way ANOVA (p<0.05).