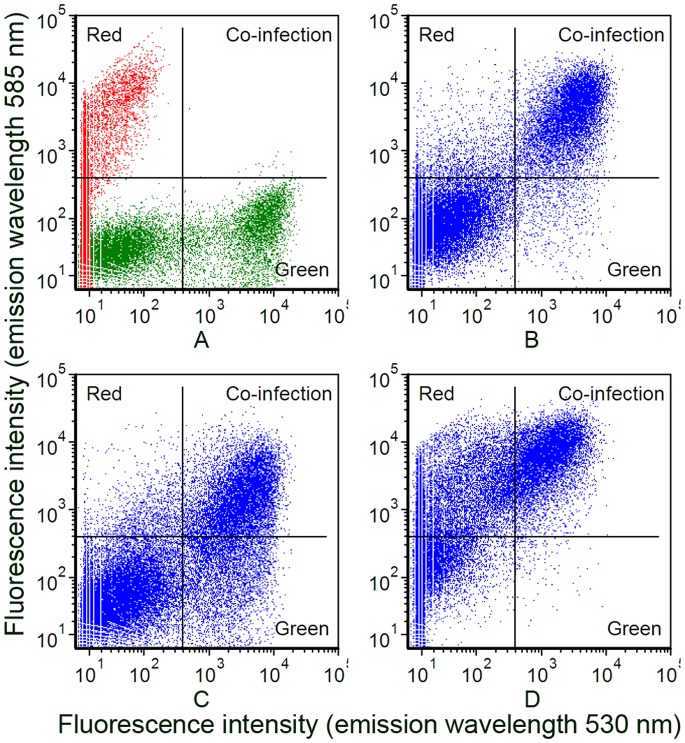
Figure 5. Detection of cell populations co-expressing EGFP and DsRed by flow cytometry.
A. Individually infected cells. Sf9 cells individually infected with 1 MOI of vAcBacGFP and vAcBacDsRed were mixed at 48 hpi and used as the reference to gate the two-colored and single-colored cell subsets. B. Cells co-infected with vAcBacGFP and vAcBacDsRed at the MOI of 0.5 each. C. Cells co-infected with 0.8 MOI of vAcBacGFP and 0.2 MOI of vAcBacDsRed. D. Cells co-infected with 0.2 MOI of vAcBacGFP and 0.8 MOI of vAcBacDsRed.

