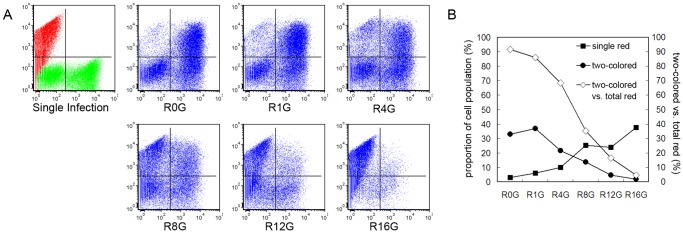
Figure 8. Flow cytometry analysis of Sf9 cells re-infected with homologous baculoviruses.

Sf9 cells were primarily infected with 2 MOI of vAcBacDsRed, and subsequently infected by 4 MOI of vAcBacGFP at an interval of 0 (R0G), 1 (R1G), 4 (R4G), 8 (R8G), 12 (R12G) or 16 (R16G) hours. A. Protein expression was analyzed at 48 hpi of infection by vAcBacDsRed. Single infection: Sf9 cells were infected individually with vAcBacGFP and vAcBacDsRed then mixed at 48 hpi and used as the reference to gate the two-colored and single-colored cell subsets. B. Comparison of the fluorescent cell populations at 2 days post the first virus infection. Curves were drawn from the flow cytometry data shown in A. C. Comparison of the fluorescent cell populations at 3 days post the first virus infection.
