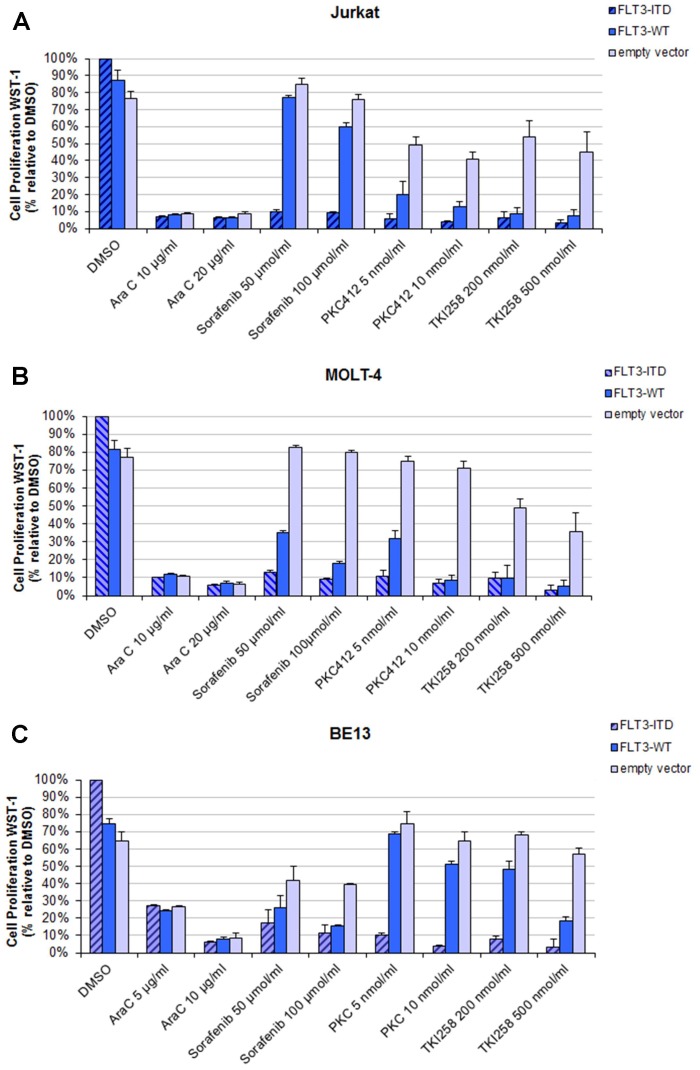
Figure 2. Effects of tyrosine kinase inhibitors on proliferation in T-ALL cell lines transfected with FLT3 expression constructs (A–C).
Fourty-eight hours (hrs) after transfection, cells were seeded and cultured for additionally 48 hrs with tyrosine kinase inhibitors (PKC412, TKI258, and Sorafenib) and chemotherapy (AraC). Cell proliferation was measured using the WST-1 proliferation reagent. The mean optical density (OD) values corresponding to non-treated FLT3-ITD transfected cells were taken as 100%. The results were expressed in percentages of the OD of treated versus untreated control cells. Two experiments were performed in duplicates. For each drug two different doses were used. All results were expressed as means ±S.D. A: Jurkat cells. B: MOLT4 cells. C: BE13 cells.

