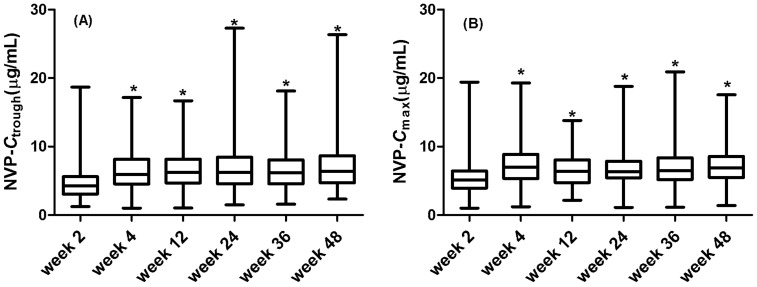
Figure 2. Comparison of nevirapine plasma concentrations between lead-in and steady-state periods during follow-up 48 weeks.
The differences between lead-in and steady-state periods for nevirapine (A) trough (P<0.0001) and (B) peak (P<0.0001) concentrations were assessed by the Kruskal-Wallis H test.

