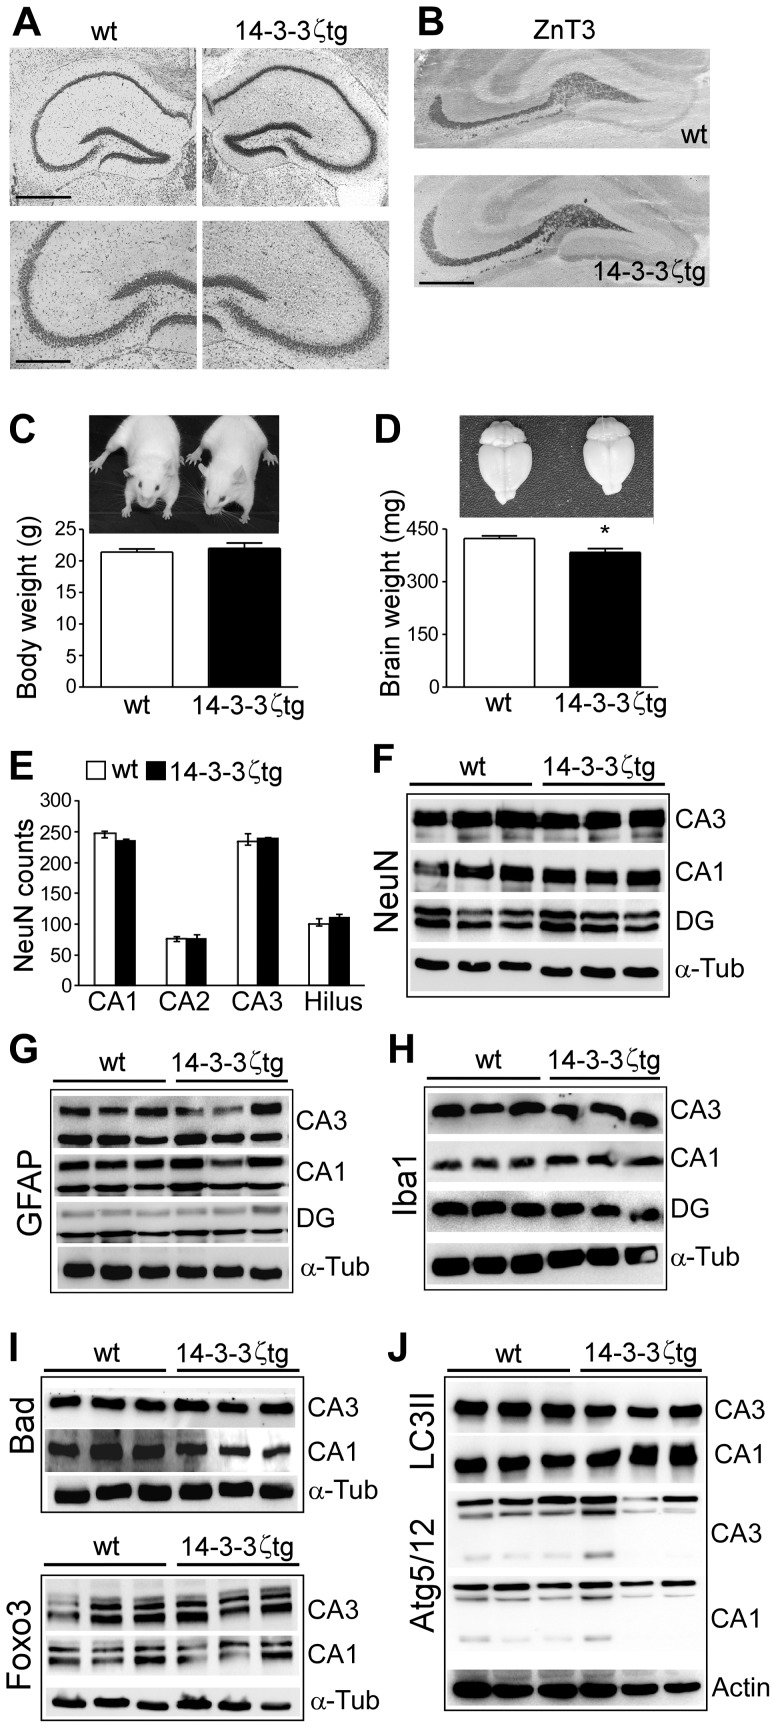
Figure 2. Hippocampal morphology and levels of apoptosis- and autophagy-related proteins in 14-3-3ζtg mice.
(A) Nissl-stained sections of wt and 14-3-3ζtg mice. Scale bar, (top) 600 µm; (bottom), 330 µm. (B) Immunohistochemistry showing similar pattern of ZnT3 staining, a protein present in mossy fibers, in wt and 14-3-3ζtg mice. Scale bar, 500 µm. (C) Body weight in wt and 14-3-3ζtg mice at 6 weeks of age (n = 8 per group). (D) Brain weight in wt and 14-3-3ζtg mice at 6 weeks of age (n = 6 per group). *p<0.05 compared to wt. (E) NeuN counts in hippocampal subfields from sections of dorsal hippocampus from wt and 14-3-3ζtg mice (n = 6 per group). (F-J) Representative western blots (n = 1 per lane) showing similar levels of (F) NeuN, (G) the astrocyte marker GFAP, (H) microglia marker Iba1, (I) apoptosis-associated 14-3-3 binding proteins and (J) autophagy-related 14-3-3 binding proteins, in adult wt and 14-3-3ζtg mice.

