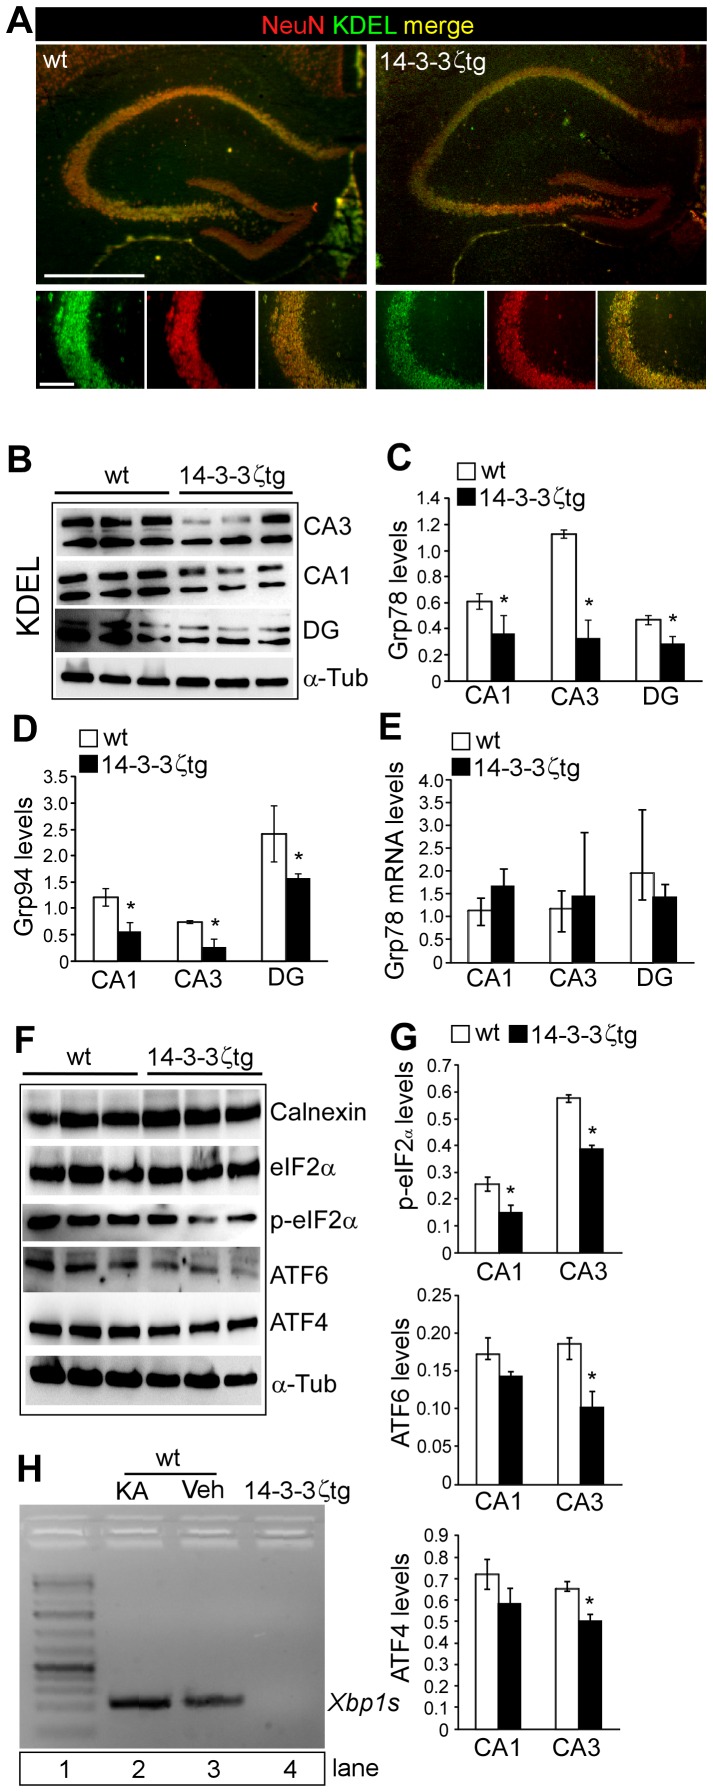
Figure 3. Reduced levels of ER and UPR-related proteins in 14-3-3ζtg mice.
(A) Representative KDEL (green) immunostaining for wt and 14-3-3ζtg mice hippocampus. Neurons are identified by NeuN counterstaining (red). Merged panels confirm staining is neuronal. Note, lower KDEL immunoreactivity in 14-3-3ζtg mice. Scale bar (top), 700 µm; (bottom), 150 µm. (B) Representative western blots (n = 1 per lane) showing KDEL-containing proteins in microdissected subfields of wt and 14-3-3ζtg mice. (C, D) Basal Grp78 and Grp94 protein levels in wt and 14-3-3ζtg mice (n = 3 per group). (E) Real-time PCR measurement of Grp78 levels in wt and 14-3-3ζtg mice in each subfield (n = 3 per group). (F) Western blots (n = 1 per lane) showing levels of various ER-related proteins in the CA3 subfield of 14-3-3ζtg mice compared to wt mice. (G) Graphs showing lower basal levels of p-eIF2α, ATF6 and ATF4 in select hippocampal subfields (n = 3 per group). (H) Gel showing levels of the spiced form of Xbp1 from hippocampal lysates of; (lane 2) WT mice subject to seizures levels, (lane 3) Wt mice, (lane 4) 14-3-3ζtg mice. Lane 1 is a ladder. *p<0.05 compared to wt.

