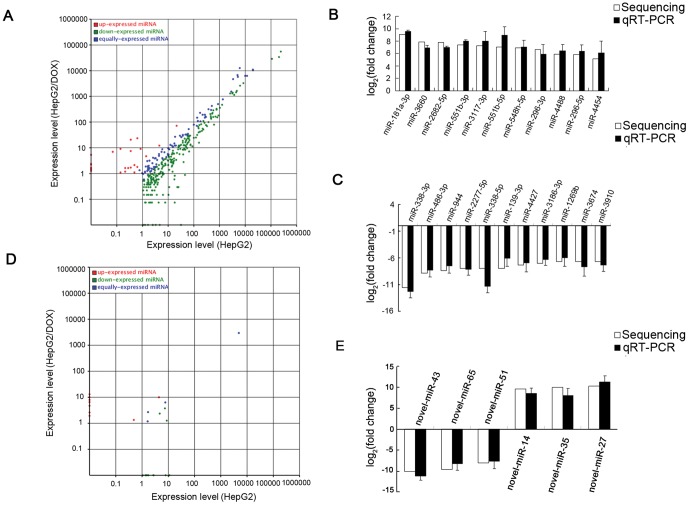
Figure 2. The miRNA expression levels from deep sequencing and validation with qRT-PCR.
(A) The scatter plot shows the expression levels of known miRNAs in HepG2 and HepG2/DOX cells. Blue dots: equally expressed miRNAs between HepG2 and HepG2/DOX; Red dots: miRNAs in HepG2/DOX were up-expressed compared to HepG2 (adjusted P<0.05); Green dots: miRNAs in HepG2/DOX were down-expressed compared to HepG2 (adjusted P<0.05). (B,C) The validation of selected up- and down-expressed known miRNAs indicated that the results from deep sequencing were generally agreed well with the qRT-PCR results. (D) The scatter plot shows the expression levels of novel miRNAs in HepG2 and HepG2/DOX cells. (E) The validation of selected novel miRNAs indicated that the results from deep sequencing were generally agreed well with the qRT-PCR results.

