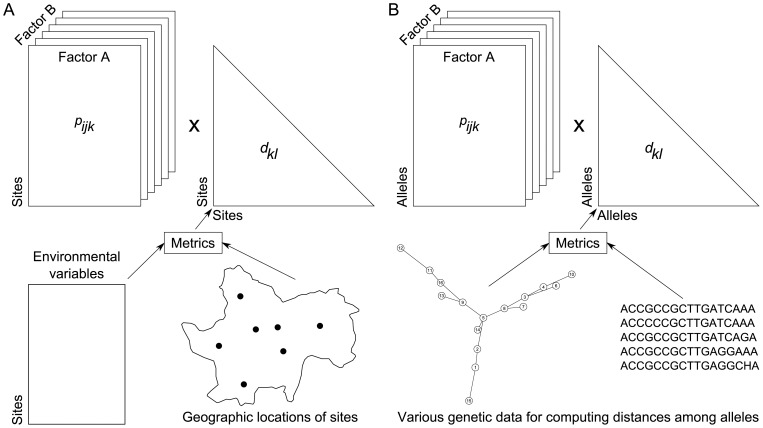
Figure 5. Examples of other types of data sets that might be processed using crossed-DPCoA (see Fig. 1).
(A) Here the  might represent the relative abundance of species i within site k measured in a particular condition j (say for instance year j). The two crossed factors in that case are species and years. The objective might be to analyse temporal changes in the similarities of environmental niches among species (change in the patterns of co-occurrence across years). Distance metrics are used to transform raw data (here tables of environmental variables) into a symmetrical matrix of distances among sites (the metrics used with species functional traits can also be used with site environmental variables, see QE–Quadratic entropy for details). (B) Here the
  might represent the relative abundance of allele k within population ij characterized by the ith level of a factor A and the jth level of a factor B. Distance metrics are used to transform raw data (here tables that describe the alleles) into a symmetrical matrix of distances among alleles (see for instance [62]).

