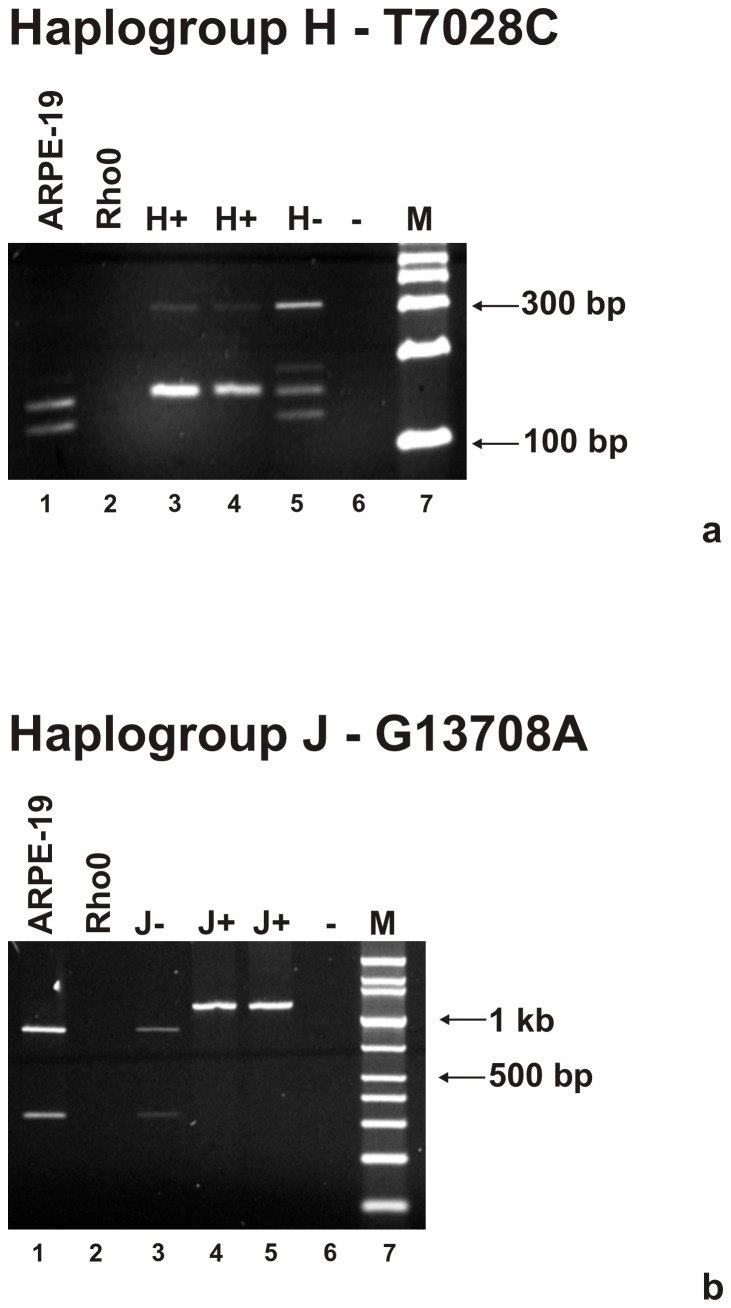
Figure 1. Agarose gels showing bands obtained after PCR amplification and restriction enzyme digestion of the H haplogroup and J haplogroup cybrids.
Figure 1a: Panel Upper – Digestion pattern of T7028C that defines the H haplogroup appears in lanes 3 and 4. The non-H haplogroup samples appear in lanes 1 and 5. Figure 1b: Panel Lower – Digestion pattern of G13708A that defines the J haplogroup is found in lanes 4 and 5. The non-J samples are in lanes 1 and 3. The Rho0 sample lacks mtDNA PCR amplification product (lane 2, upper and lower panels). M = marker; - indicates water only; bp, basepair.

