


Fig. 3.
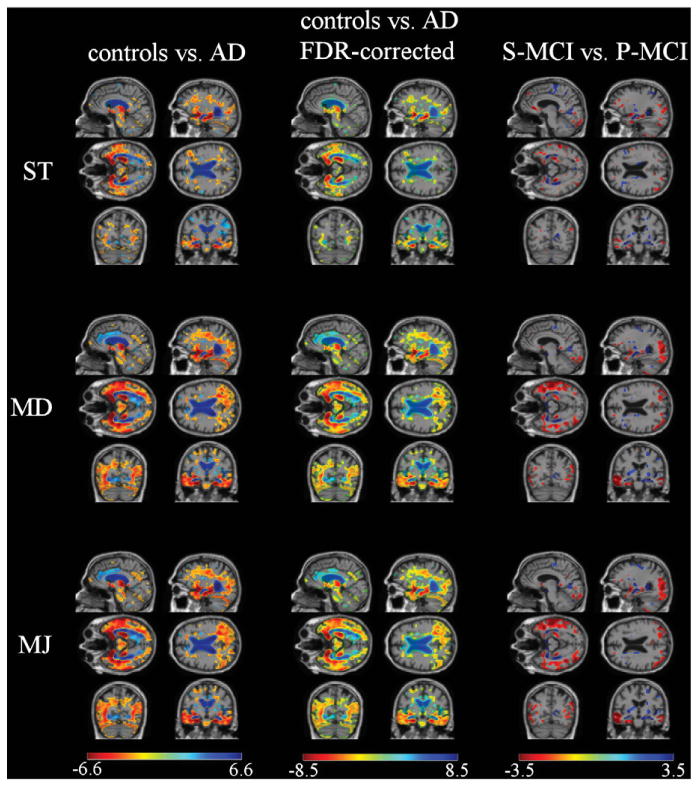
T-maps of group-level dataset for three methods both for controls vs. AD and S-MCI vs. P-MCI comparisons. Only the voxels with statistically significant differences (p<0.05) are shown.
Official websites use .gov
A
.gov website belongs to an official
government organization in the United States.
Secure .gov websites use HTTPS
A lock (
) or https:// means you've safely
connected to the .gov website. Share sensitive
information only on official, secure websites.
T-maps of group-level dataset for three methods both for controls vs. AD and S-MCI vs. P-MCI comparisons. Only the voxels with statistically significant differences (p<0.05) are shown.