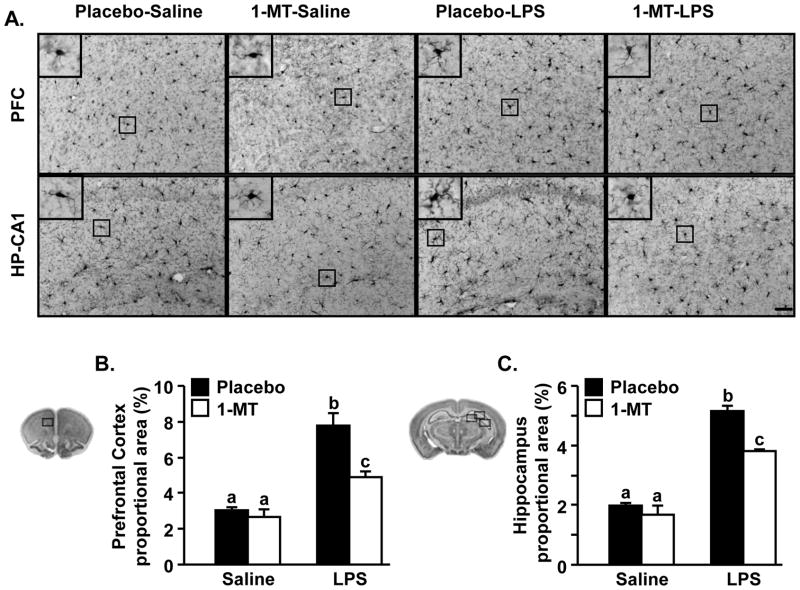
Figure 5. LPS-induced microglial activation in the prefrontal cortex (PFC) and hippocampus (HPC) of CX3CR1−/− mice was attenuated by 1-MT.
CX3CR1−/− mice were implanted s.c. with either placebo or 1-MT filled pellets three days prior to i.p. injection of saline or LPS (0.5 mg/kg). Brains were collected, fixed, and processed 72 h later A) Representative images of Iba-1 staining in the PFC (top panels) and in the CA1 region of the hippocampus (bottom panels) are shown. Scale bars represent 50 μm. For each region there are 40x images that are inset (top left corner) to show selected microglia. Proportional area of Iba-1 staining in the B) PFC and C) HPC are shown. Bars represent the mean ± SEM. Means with different letters (a, b, or c) are significantly different (p < 0.05) from each other.

