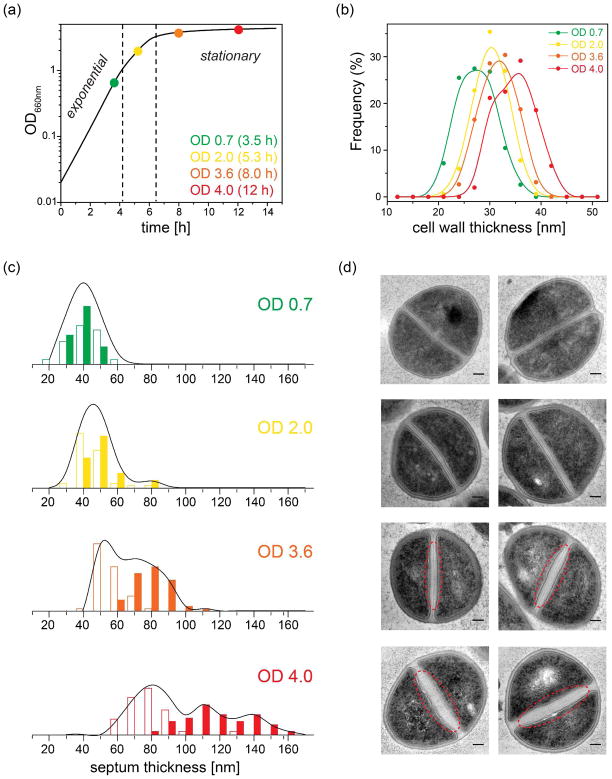
Figure 2. S. aureus cell wall morphology is a function of growth stage in SASM.
(a) Growth curve of S. aureus strain 29213 in SASM broth at 37 °C with 200 rpm shaking monitored by optical density at 660 nm (color dots indicate sample points taken in this study). (b) Cell-wall thickness distribution measured from TEM ultrathin sections of S. aureus whole cells at different OD values. (c) Septum thickness distribution and (d) corresponding TEM images of ultrathin sections of S. aureus cells harvested at four different growth stages. The open columns represent the septum thickness near the edge while the solid columns represent the thickness in the center. Each black line outlines the overall septum thickness distribution (the sum of all measured center and edge thickness). Non-uniform thickening is indicated with red dashed lines in the TEM images of cells harvested at OD 3.6 and OD 4. Scale bars are 100 nm.

