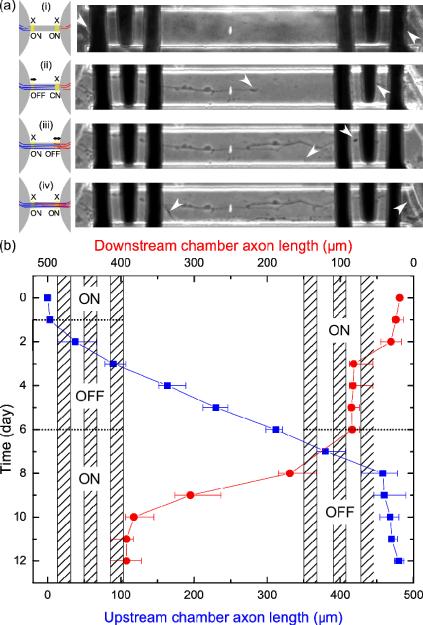
Fig. 5.
(a): Schematic (left) and phase images (right) of the axon-lock system where growth cones are pinpointed by an oriented white arrow. The middle of the channel is highlighted by a white spot. (i) Both gates closed, no axons enter microchannel. (ii) Left gate opened, and a single axon enters from the left. (iii) Left gate closed and right gate opened. (iv) Once the first axon passes completely beyond the gate, both gates are closed. (b) Measured lengths of axons migrating from the upstream microchamber (blue) and the downstream microchamber (red) along with the activation timing of the left and right gates.

