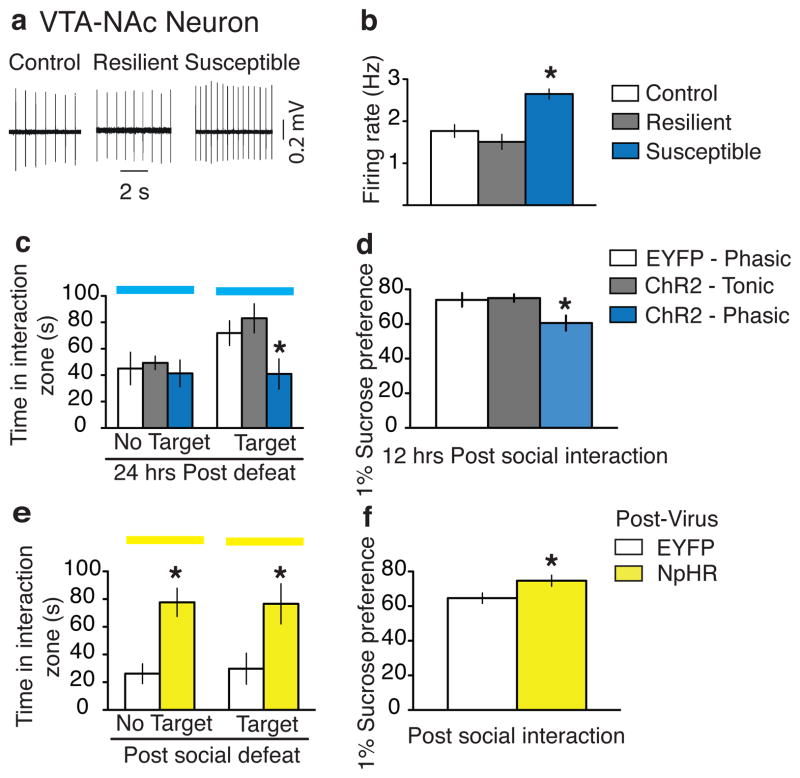
Figure 3. Bidirectional effect of modulating the VTA-NAc pathway on susceptibility to social defeat.
a, Sample traces recorded from VTA-NAc neurons in VTA slices. b, Firing rates of VTA-NAc neurons from control, resilient, and susceptible mice (F2,89 = 15.77, p<0.001; post-hoc test, * p<0.001; n=12–52). c, Social interaction data obtained during optical stimulation of VTA-NAc neurons in control, tonic, and phasic groups. (F2,20 = 4.43, p<0.05; post-hoc test: * p<0.05; n=5–10). d, Sucrose preference data measured over a 12-hr period after the social interaction test. (F2,18 = 4.80, p<0.05; post-hoc test, * p<0.05; n=5–9). e, Social interaction during optical inhibition of VTA-NAc neurons in previously susceptible mice (No target: t15 = 4.2, * p<0.001; two tailed t-test, n=8-9; Target: t15 = 2.6, * p<0.05; two tailed t-test, n=8–9). f, Sucrose preference measured over a 12-hr period after the social interaction test (t14 = 2.3, * p<0.05; two tailed t-test, n=8–9). All bar graphs depict ± s.e.m.

