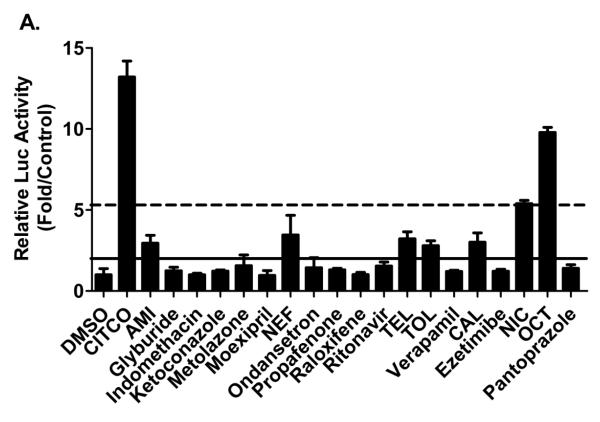
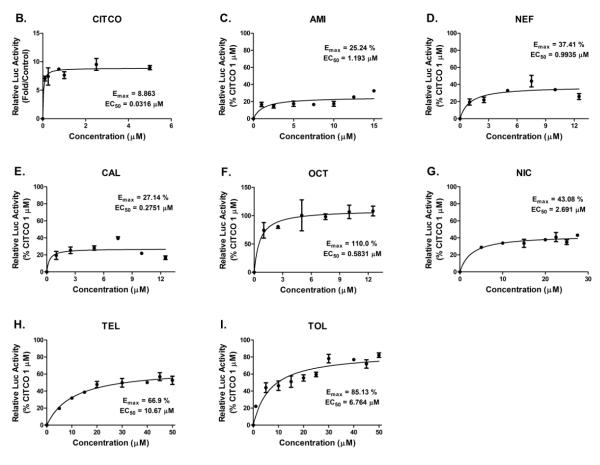
Figure 2. Activation of hCAR in HepG2 cells.
HepG2 cells were transfected with hCAR1+A expression and CYP2B6 reporter constructs, then treated for 24 hours with vehicle control (0.1% DMSO), positive control CITCO (1 μM), and test compounds at a dose of 10 μM each (A) or in a concentration-dependent manner (C-I). The Emax and EC50 values of CITCO were based on multi-concentration treatment (B). The solid and dotted lines represent 40% and 15% of activation attained by CITCO (1 μM). Data represent mean ± SD (n = 3). *: P<0.05, **: P<0.01, ***: P<0.001.


