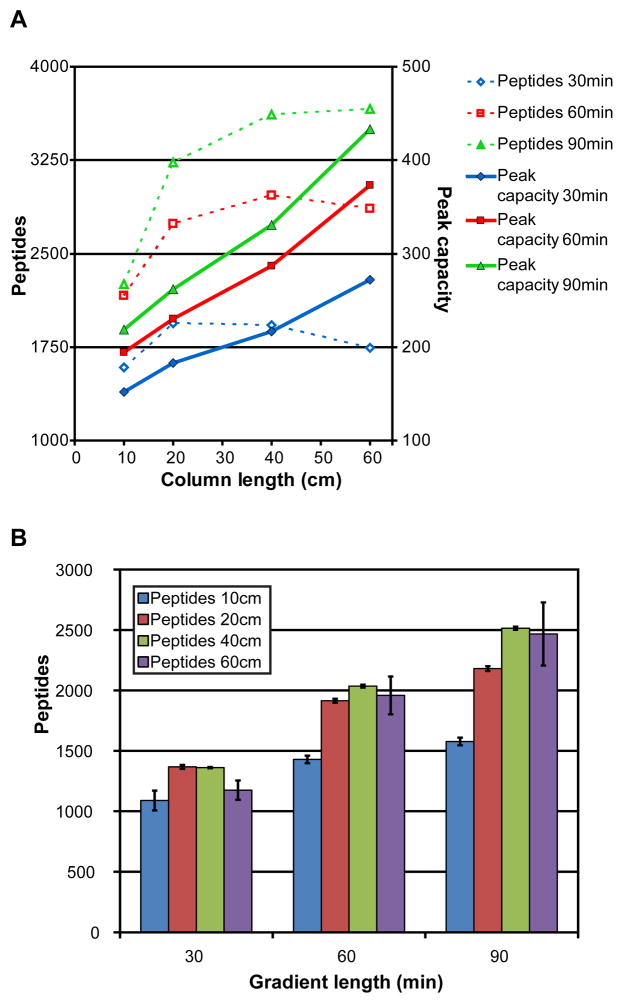
Figure 1.
A)Peptide identifications and peak capacity measurements are plotted for the analyses done in this study. Each combination of column and gradient lengths was run in triplicate. The total number of peptides identified by database search and the average calculated peak capacity are shown. B) The average number of peptide identifications from the analyses are plotted in bar plot form. The standard deviation of the number of peptide identifications is indicated by the error bars.

