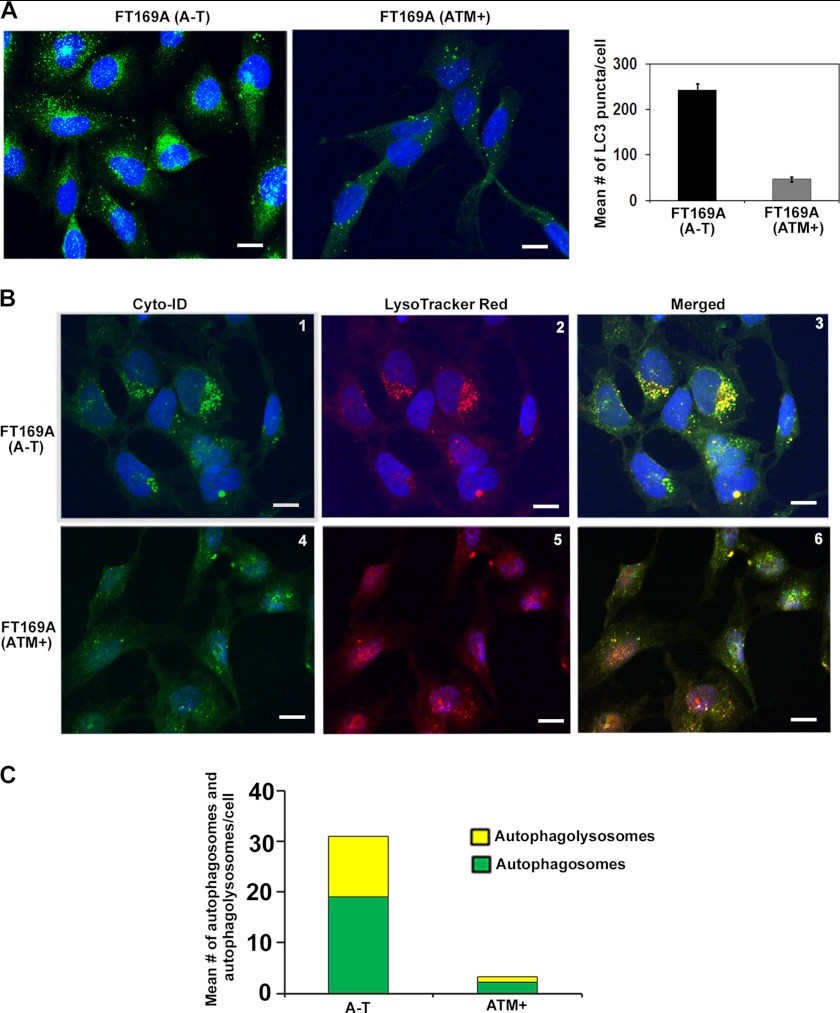
FIGURE 2.
Basal autophagy is activated in A-T cells. A, representative immunofluorescence images of LC3 puncta in A-T and ATM+ cells are shown (left) (scale bar, 10 μm); the average number ± S.E. (error bars) of puncta counted in 50 cells in different fields is shown in the bar graph (right). B, representative images of A-T (panels 1–3) and ATM+ (panels 4–6) cells co-stained with Cyt-ID® and LysoTracker Red® dyes are shown (scale bar, 10 μm). C, green (autophagosomes; from Cyt-ID®-stained panels) and yellow (autophagolysosomes; from merged panels) dots in cells were counted manually using the ImageJ plug-in cell counter. The average number of dots/cell is shown in the bar graph. Experiments were repeated two times with similar results.

