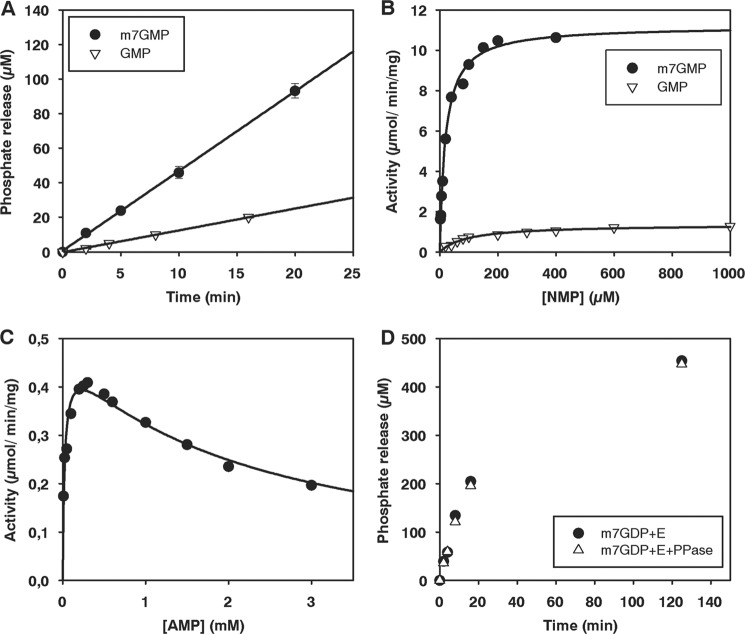
FIGURE 6.
Nucleotidase activity of Drosophila CG3362 measured by a colorimetric assay for inorganic phosphate. A, time course of phosphate release with m7GMP and GMP is shown. Enzyme was used at a concentration of 13.8 nm and substrates at 200 μm. The standard deviation, based on three independent experiments, is shown. B, titration of m7GMP and GMP is shown. Enzyme concentrations of 13.8–55 nm were used to determine initial rates. Curves were fitted to the Michaelis-Menten equation. C, titration of AMP is shown. Enzyme was used at a concentration of 1.4 μm. The data were fitted as described under “Experimental Procedures.” D, time courses of phosphate release from m7GDP are shown. Enzyme was used at 2.8 μm and substrate at 200 μm. The reactions were carried out with or without the addition of 1 unit of pyrophosphatase per 100 μl reaction, as indicated.

