FIGURE 2.
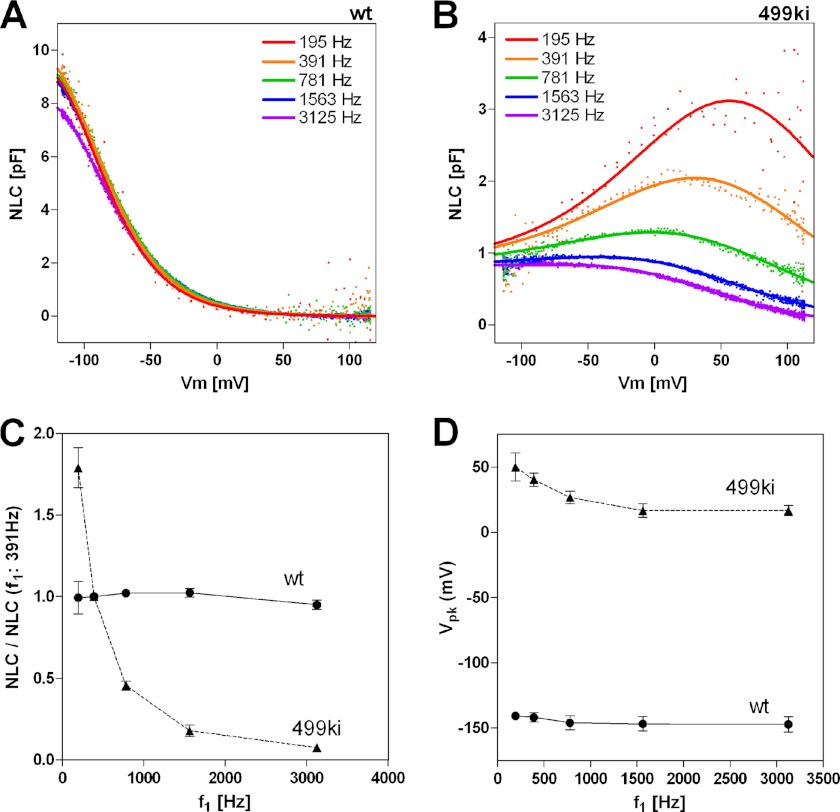
Voltage stimulus frequency-dependent NLC measurement. Examples of stimulus frequency-dependent NLC measurements on WT (A; n = 5) and 499ki OHCs (B; n = 5) are shown. NLC measurements were performed using five different f1 frequencies with corresponding f2 frequencies being twice as large as f1. Equations 3 and 4 were used to determine the Qmax values of WT and 499ki OHCs, respectively. The obtained Qmax values were divided by those determined at 390.6 Hz, and resulting quotients were plotted as a function of the f1 stimulus frequency in C. Vpk values were also plotted as a function of the f1 stimulus frequency in D. Error bars represent S.D.

