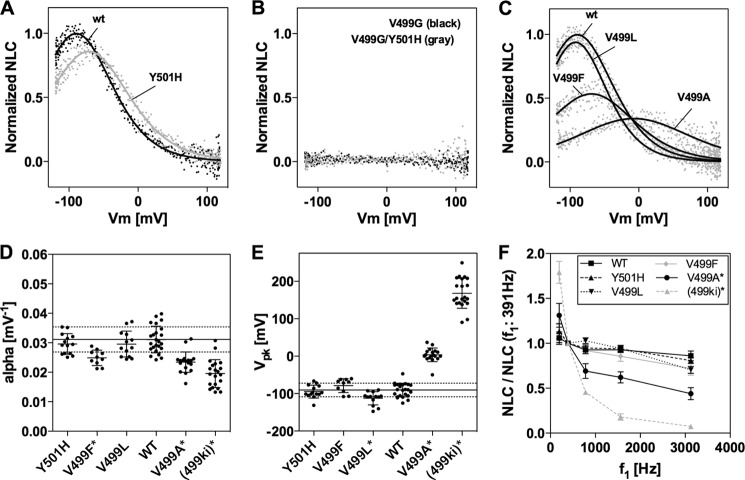
FIGURE 4.
NLC of various prestin constructs measured in HEK293T cells. A, examples of NLC measured on HEK293T cells expressing WT-prestin or Y501H prestin. B, examples of NLC measured on HEK293T cells expressing V499G or V499G/Y501H prestin. Each construct contains a C-terminally attached enhanced GFP tag for visual confirmation of successful heterologous expression. C, NLC of various prestin mutants. Representative NLC of WT-prestin and V499L, V499F, and V499A prestin mutants are shown. D and E, summary of NLC parameters in various prestin mutants. All NLC measurements were performed under the chloride condition. NLC data were analyzed using Equation 3 and Equation 4 (for V499A) to determine NLC parameters for each prestin construct. Obtained α and Vpk values are summarized in D and in E, respectively. The α and Vpk values (mean ± S.D.) were as follows: WT, 0.031 ± 0.005 mV−1 and −91 ± 18 mV (n = 24); Y501H, 0.030 ± 0.003 mV−1 and −95 ± 17 mV (n = 14); V499A, 0.023 ± 0.003 mV−1 and 3.5 ± 18 mV (n = 18); V499L, 0.030 ± 0.004 mV−1 and −113 ± 18 mV (n = 13); and V499F, 0.025 ± 0.003 mV−1 and −79 ± 19 mV (n = 10). The horizontal solid and broken lines indicate the means and S.D. of WT. The asterisks shown after the construct name indicate a statistically significant difference (p < 0.05) compared with WT. Because the NLC of V499G and V499G/Y501H was too small to be detected in HEK293T cells, the α and Vpk data for V499G/Y501H were obtained from 499ki OHC recordings (Table 1 and Fig. 6). F, voltage stimulus frequency dependence. NLC measurements were performed on HEK293T cells expressing various prestin constructs (WT (n = 6), Y501H (n = 5), V499L (n = 5), V499F (n = 4), and V499A (n = 7)) and using five different f1 frequencies (195.3, 390.6, 781.3, 1563, and 3125 Hz). The corresponding f2 frequencies were twice as large as f1. The obtained Qmax values were divided by those determined at 390.6 Hz, and resulting quotients were plotted against the f1 stimulus frequency. The data for (499ki) are from Fig. 2. Examples of stimulus frequency-dependent NLC can be found in supplemental Fig. S3. Error bars represent S.D.

