FIGURE 6.

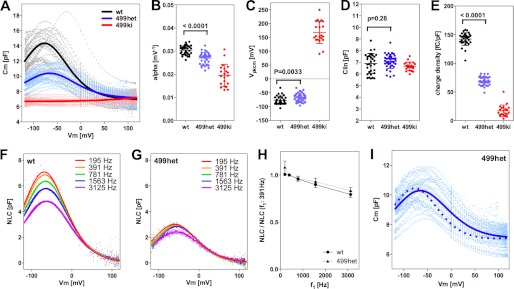
Distinct prestin-dependent charge movement of 499het. A–E, NLC observed in WT, 499het, and 499ki OHCs. Gray, blue, and red dots represent individual NLC recordings. Curve fit analyses using Equation 3 were performed on individual recordings to obtain the statistics summarized in B–E and Table 1 as means ± S.D. Average NLC curves generated using the NLC parameters summarized in Table 1 are shown with bold solid lines in A. F–H, voltage stimulus frequency-dependent NLC in WT and 499het OHCs. NLC measurements were performed on WT (n = 3) and 499het (n = 4) OHCs under the chloride condition using five different f1 frequencies (195.3, 390.6, 781.3, 1563, and 3125 Hz). The corresponding f2 frequencies were twice as large as f1. Representative recordings for WT (F) and 499het (G) are shown. The obtained Qmax values were divided by those determined at 390.6 Hz, and resulting quotients were plotted against f1 stimulus frequency in H. Differences between WT and 499het are not significant. I, interpretation of 499het NLC. Using WT NLC (Cm(WT)) and 499ki NLC (Cm(499ki)) as defined by the NLC parameters summarized in Table 1 (shown with bold black and red lines in A), four different prestin models (monomer (Equation 5), dimer (Equation 6), trimer (Equation 7), and tetramer (Equation 8)) were tested to see which model best explains the observed 499het NLC data shown with pale blue dots (total 36 NLC recordings). The broken line indicates the monomer-based curve fit, whereas the solid line indicates the dimer-based curve fit. Trimer- and tetramer-based curve fits generated lines that looked no different from that of the dimer model. Fitting parameters obtained by the analyses are summarized in Table 2. The apparent line at 0 mV is a result of NLC data correction by the series resistance, Rs. The NLC data were individually corrected because of different Rs values among recordings. Because the data points at 0 mV did not change with the correction, an “apparent” vertical line emerges. Error bars represent S.D.
