
FIGURE 5.
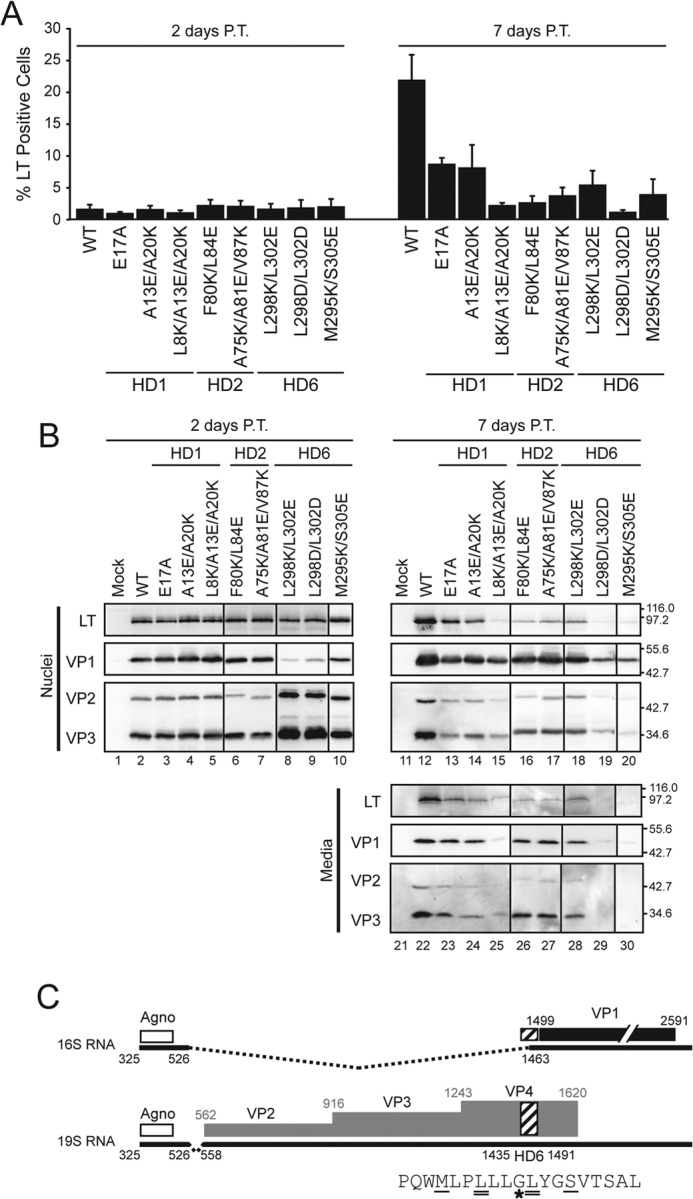
Introducing charged residues into individual hydrophobic domains inhibit viral propagation. A, BS-C-1 cells were transfected with wild type or mutant SV40 genomes as indicated. The percentage of infected cells was determined based on LT expression using flow cytometry after 2 days (left plot) and 7 days (right plot). Error bars represent the standard deviation of at least three independent experiments. B, BS-C-1 cells were transfected as in A, and the nuclei and media were immunoblotted and probed with the indicated antibodies after 2 days (left panel) or 7 days (right panel) post-transfection (P.T.). Molecular weight markers are indicated in kDa on the right. C, splicing of SV40 mRNA. The white, black, and gray regions denote the coding region for agnoprotein (Agno), VP1 and VP2/3/4, respectively. The 16S and 19S mRNA species are indicated with black lines where dashed pieces are removed by splicing to the mature forms. HD6 is highlighted by the hatched box and indicated within the splice site utilized to produce the 16S mRNA. The HD6 amino acid sequence (shown below) denotes the mutated L298/L302 residues as designated by double underlines and the M295K/S305E mutations is denoted by single underline. The star denotes the Gly codon that is the major splice site used to produce the 16S mRNA. This figure was adapted from Ref. 31.