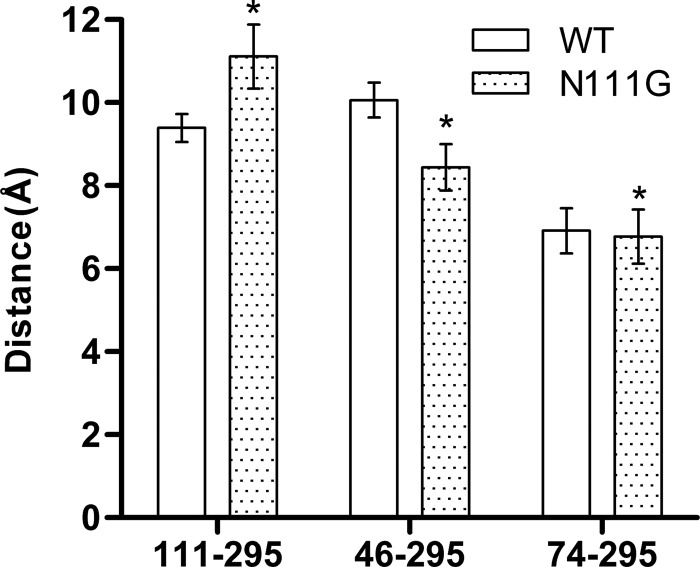
FIGURE 6.
Conformational changes between the AT1 receptor and N111G-AT1 receptors revealed by the analysis of the MD trajectories. Histograms of the average distance between the Cα atoms of residues 1113.35 and N2957.46, N461.50 and N2957.46, and D742.50 and N2957.46 are shown. Data are the mean ± S.D. (error bars) of 2100 frames from each 84-ns MD trajectory. *, significantly different from AT1 receptor (p < 0.01).

