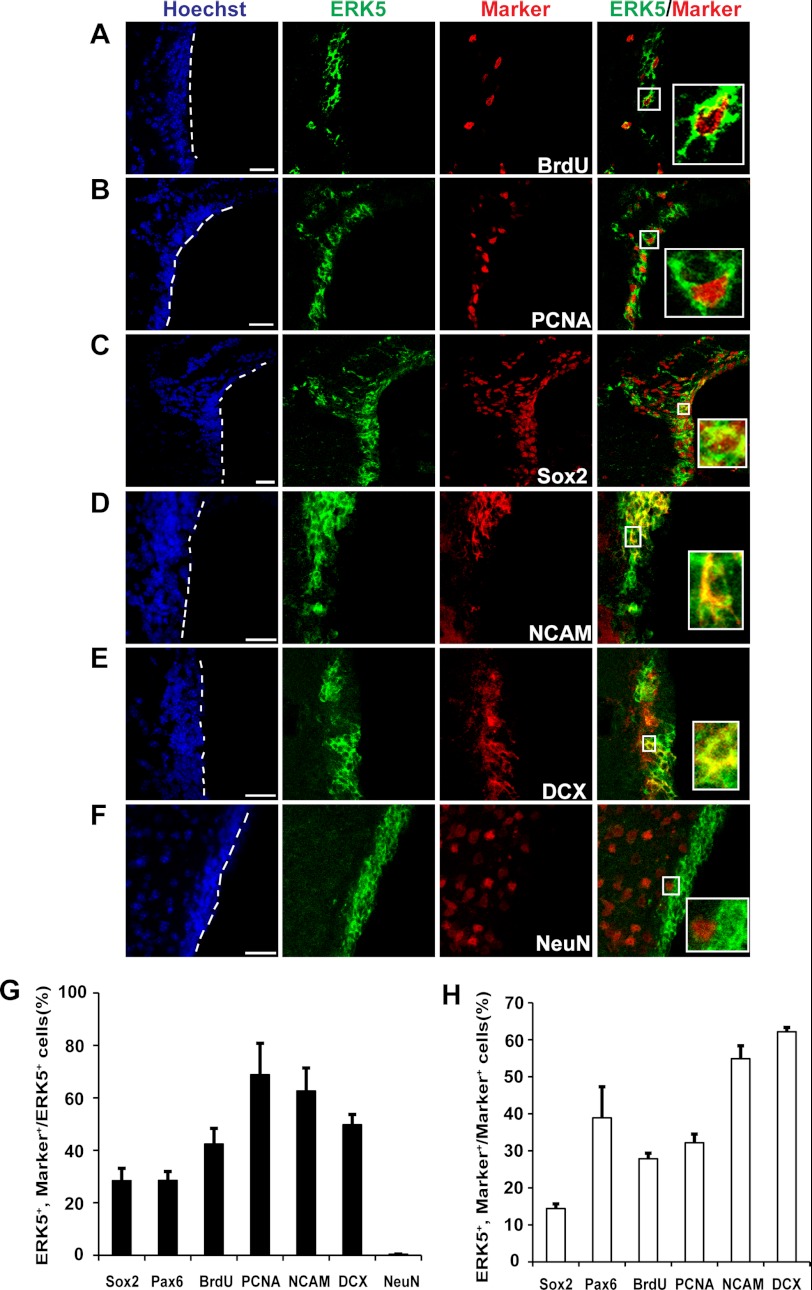
FIGURE 6.
Characterization of ERK5 expression in the SVZ of the adult mouse brain. A&–F, representative confocal images of brain sections co-stained for ERK5 and BrdU (A), PCNA (B), Sox2 (C), PSA-NCAM (D), DCX (E), and NeuN (F). Hoechst staining (blue) was used to identify all cell nuclei. Scale bar: 25 μm. G, quantification of marker-positive cells in total ERK5+ cell population along the SVZ. H, quantification of ERK5+ cells in total marker-positive cell population along the SVZ. Data represent mean percentage of double-labeled cells.

