FIGURE 5.
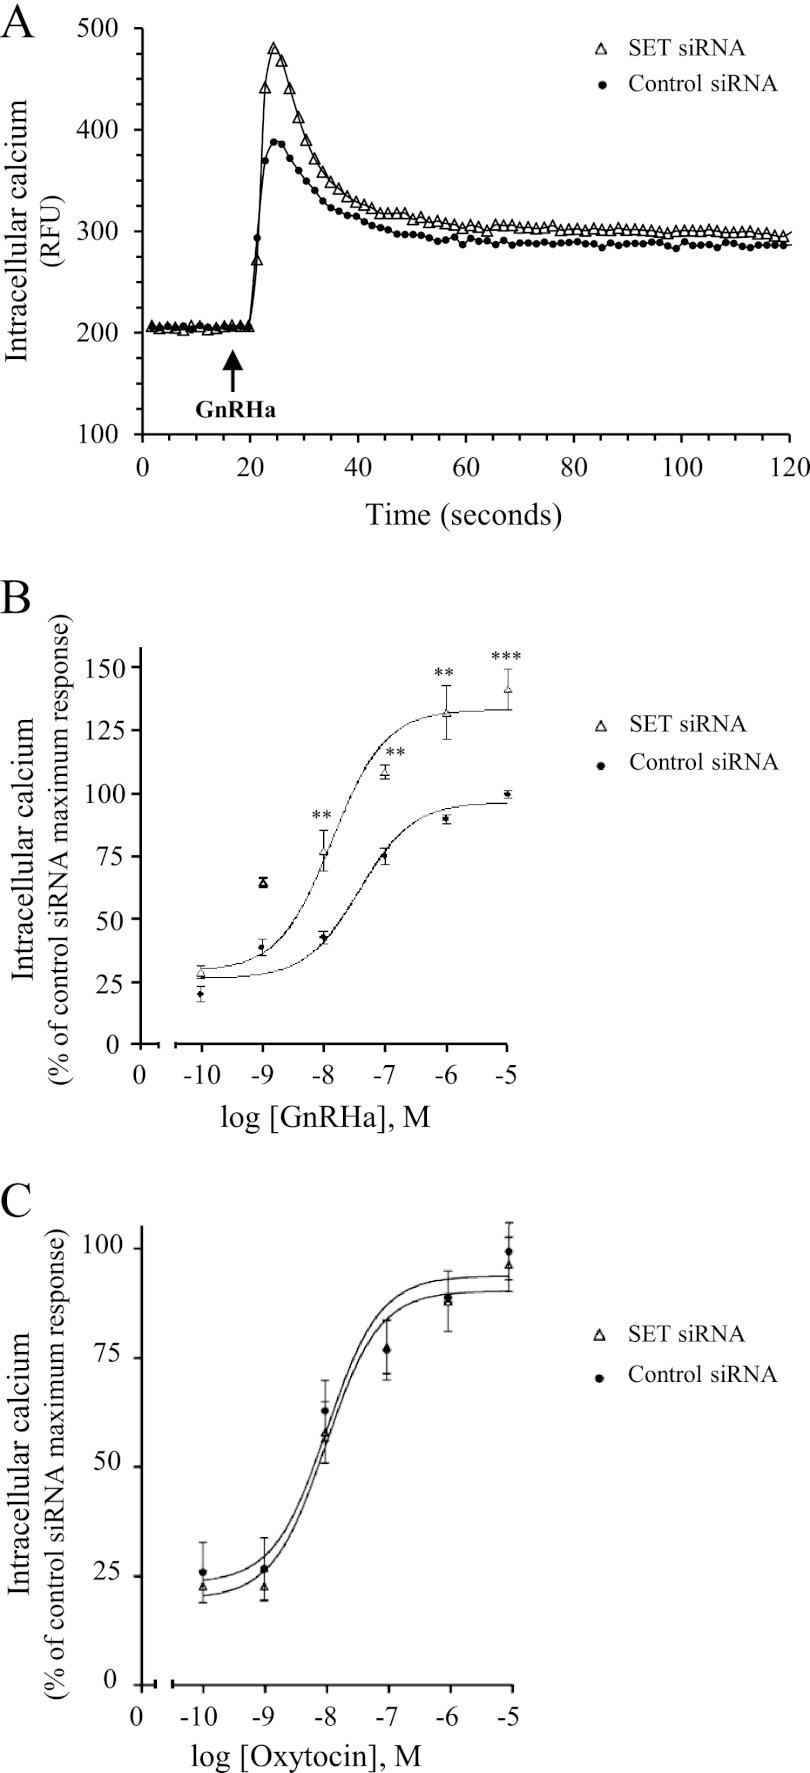
Effect of SET knockdown on GnRH-induced calcium mobilization in gonadotrope cells. αT3-1 cells transfected with control or SET siRNA were plated in 96-well black plates precoated with poly-l-lysine and loaded with calcium fluorescent dye. Excitation fluorescence was set at 485 nm, and emission was detected at 525 nm (515-nm emission cut-off filter) using the FlexStation III microplate reader (Molecular Devices). A, cells were stimulated with 1 μm GnRHa, and intracellular calcium mobilization was measured every 1.5 s during the following 2 min. Results are expressed as relative fluorescence units (RFU). Data are representative of three independent experiments performed in triplicate. Kinetics of calcium mobilization (t½ = 2.5 ± 0.5 and 3 ± 0.9 s for control siRNA and SET siRNA, respectively), decay profiles (64 ± 1.3 and 70 ± 15% decrease for control siRNA and SET siRNA, respectively), and plateau values (318 ± 8 and 329 ± 8 arbitrary units for control siRNA and SET siRNA, respectively) were unaffected by SET siRNA. B, cells were treated with increasing concentrations of GnRHa (10−10 to 10−5 m), and increases in intracellular calcium were determined by subtracting the base-line values from peak values. Results were expressed as the percentage of the maximal response in control siRNA-transfected cells. The data are presented as the mean ± S.E. of three independent experiments performed in triplicate. **, p < 0.01; ***, p < 0.001 compared with control at respective GnRHa concentrations. C, intracellular calcium mobilization in αT3-1 cells transfected with control siRNA or SET siRNA was measured in response to increasing concentrations of oxytocin (10−10 to 10−5 m) as described in B. The data are presented as the mean ± S.E. of three independent experiments performed in triplicate.

