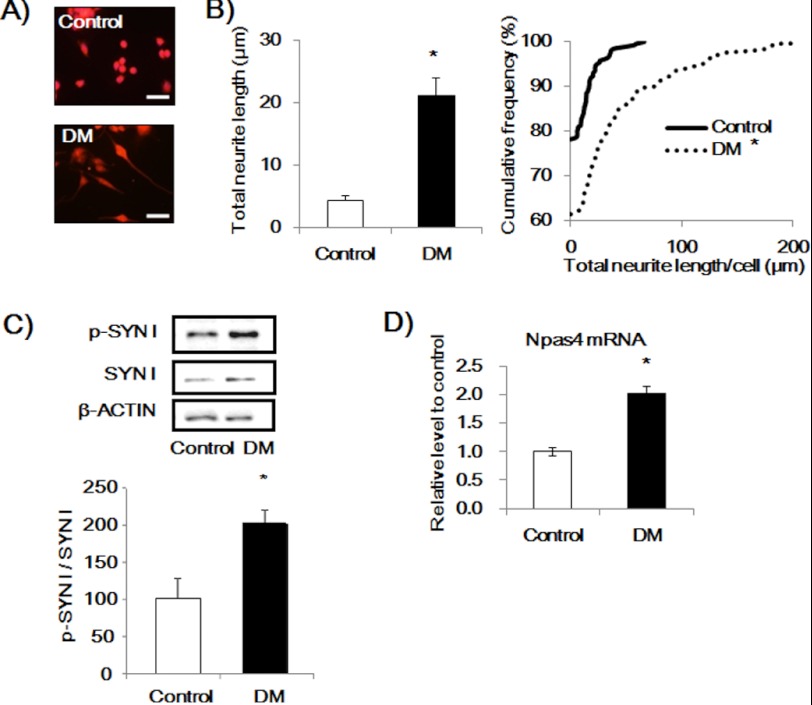
FIGURE 1.
Effect of DM treatment for 48 h on neurite outgrowth, NPAS4, and p-SYN I expression levels in Neuro2a cells. A, representative photographs showing control (top) and DM-treated cells (bottom). Scale bar, 20 μm. B, quantitative analysis of neurite length. Values indicate the mean ± S.E. (left) and the cumulative frequency of neurite length (right). (n = 261 for control and n = 251 for DM.). *, p < 0.001 versus control (Student's t test, Kolmogorov-Smirnov test). C, immunoblot analysis of p-SYN I expression levels induced by DM. Values indicate the mean ± S.E. (n = 8). *, p < 0.05 versus control (Student's t test). D, quantitative RT-PCR analysis of the Npas4 mRNA level. Values indicate the mean ± S.E. (n = 3). *, p < 0.01 versus control (Student's t test).

