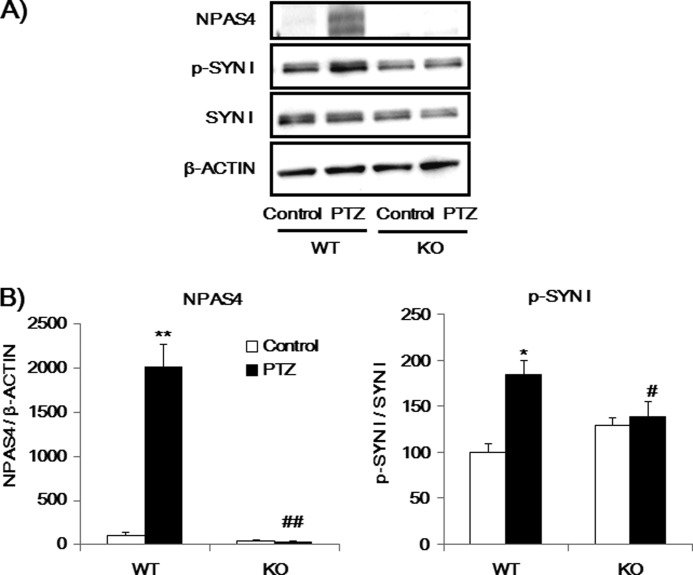
FIGURE 12.
NPAS4 is a key factor in PTZ-induced phosphorylation of SYN I. A, immunoblot analysis of NPAS4, p-SYN I, and SYN I expression levels in the prefrontal cortex of mice 2 h after PTZ injection. B, quantitative analysis of immunoblots (A). Values indicate the mean ± S.E. (n = 5–8). *, p < 0.05; **, p < 0.001 versus WT-Control. #, p < 0.05; ##, p < 0.001 versus WT-PTZ (two-way ANOVA followed by Bonferroni's test).

