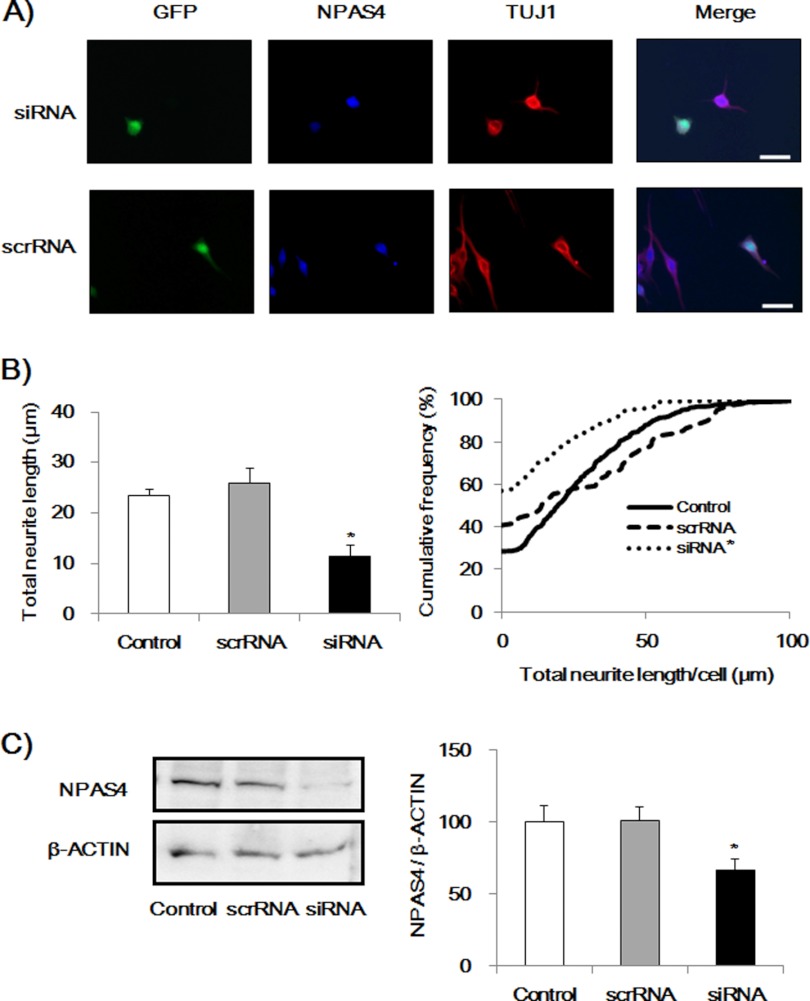
FIGURE 2.
Effect of NPAS4 knockdown on neurite outgrowth induced by DM in Neuro2a cells. A, representative photographs showing immunocytochemical analysis of siRNA- or scrRNA-transfected cells (GFP-positive). Scale bar, 20 μm. B, quantitative analysis of neurite length. Values indicate the mean ± S.E. (left) and the cumulative frequency of neurite length (right). (n = 79 for Npas4 siRNA transfection (siRNA), n = 81 for scrambled siRNA transfection (scrRNA), and n = 463 for nontransfection (control).). *, p < 0.01 versus scrRNA and control (one-way ANOVA followed by Dunnett's test, confirmed by the Kolmogorov-Smirnov test). C, immunoblot analysis of NPAS4 expression levels in control, Npas4 siRNA, or scrRNA-transfected Neuro2a cells. Seventy two hours after transfection, the medium was replaced with DM, and the cells were cultured for 24 h. Values indicate the mean ± S.E. (n = 10–11). *, p < 0.05 versus control and scrRNA (one-way ANOVA followed by Dunnett's test).

