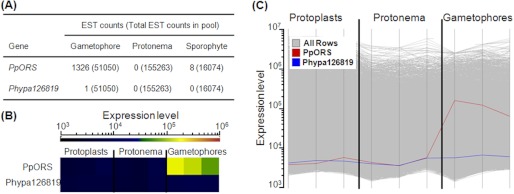
FIGURE 6.

EST profile and microarray analysis of the expression of PpORS and its paralog Phypa123819 in different Physcomitrella tissues. A, EST profile of PpORS is from the NCBI UniGene transcriptome database, whereas the only EST corresponding to Phypa123819 (BY962703) was found by blastn search against the NCBI EST database. B and C, tile display (B) and profile display (C) of the expression patterns of PpORS and Phypa123819 are shown. In the profile display the expression patterns of all other transcripts are also shown as gray lines in the background. Gene expression was assayed in three different tissue types (protoplasts, protonema, and gametophores) in three biological replicates. In B, the color of the tiles indicates the expression level of each gene in a given tissue type. As the color approaches red, the gene is expressed at a higher level. The same data are presented graphically in C. PpORS was expressed in gametophores only, whereas Phypa123819 was not expressed in all tissues tested. Values below 104 are in the background and thus were considered as not expressed.
