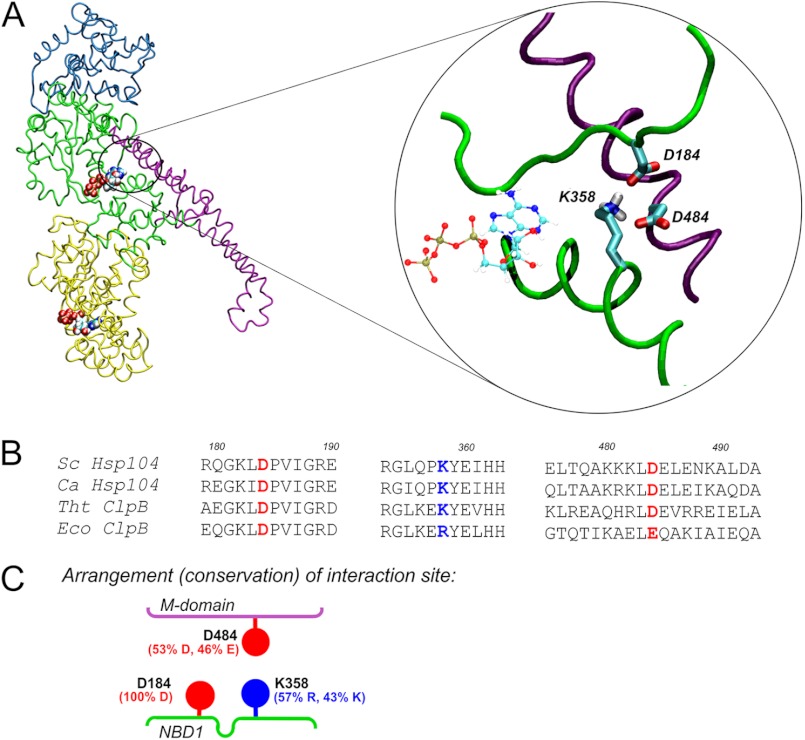
FIGURE 1.
Putative ionic interactions between M and NBD1 domains. A, the homology model of S. cerevisiae Hsp104 is shown. Domains are color coded as follows: cyan, N-terminal domain; green, NBD1; magenta, coiled-coil M domain; yellow, NBD2. ATP molecules are shown. The circled magnified fragment shows the arrangement of the indicated charged amino acid residues in an energy-minimized structure. B, shown is sequence alignment of the regions containing the Asp-184, Lys-358, and Asp-484 residues (colored red for negative, blue for positive charge). The sequences of S. cerevisiae (Sc) and Candida albicans (Ca) Hsp104 and T. thermophilus (Tht) and E. coli (Eco) ClpB proteins are shown. C, shown is schematic representation of the putative NBD1-M domain interface. The percentage of residue conservation shown in parentheses was calculated using the ConSurf server for 498 non-redundant sequences from UNIREF90 database.

