Figure 2.

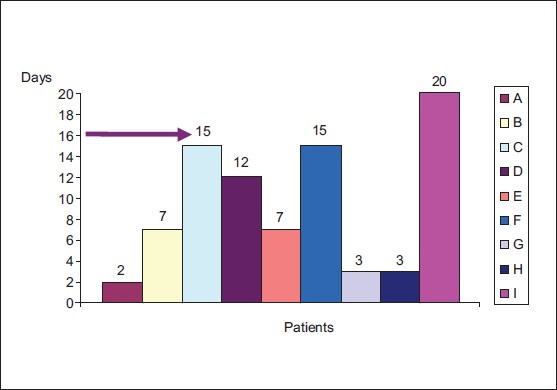
Time taken to develop maximum anisocoria (The last data point plotted for each patient (A-I) represents the maximum anisocoria recorded)

Time taken to develop maximum anisocoria (The last data point plotted for each patient (A-I) represents the maximum anisocoria recorded)